Lesson 1: The WONDER Phase
Learning Objective: By the end of this lesson, you will be able to:
- Identify the key components of the WONDER phase as the starting point of the data analysis process, including observation, questioning, hypothesis formation, and data collection.
- Develop skills for making keen observations about data and the world it represents, while recognizing common cognitive biases that can affect your analysis.
- Formulate worthwhile questions that can be answered with data, including the “Dozen Hows” categories of questions commonly applied in analytics.
- Create falsifiable hypotheses that can be tested with data and identify appropriate data sources to answer your questions.
Where are You in the Process?

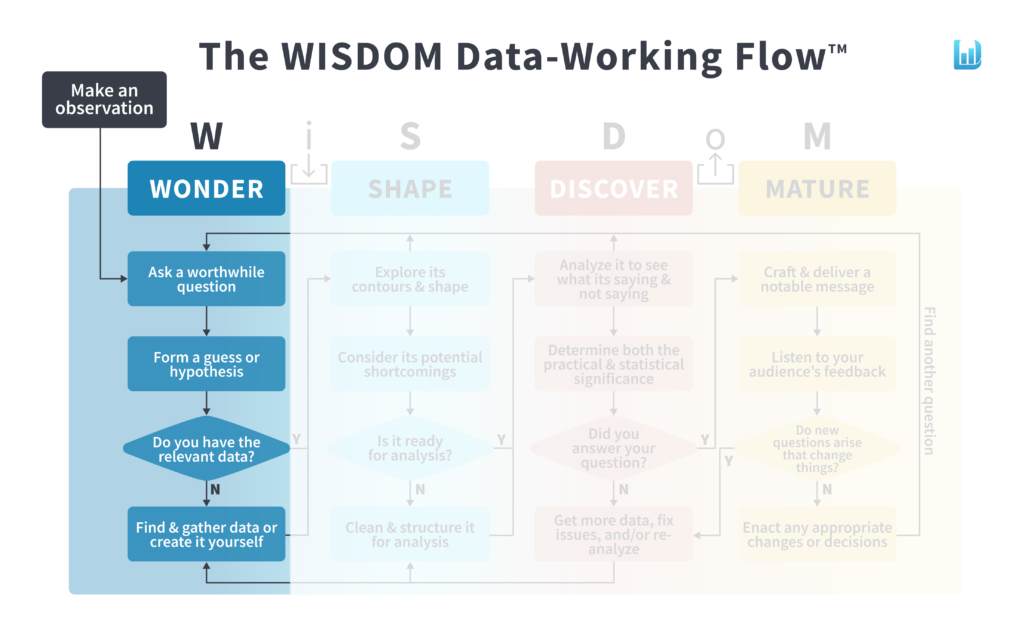
Step 0: Make an observation
“Nothing has such power to broaden the mind as the ability to investigate systematically and truly all that comes under thy observation in life” –Marcus Aurelius
The WISDOM process starts with an observation, as indicated by the black box in the top left corner. If you want to be a great data analyst, the most important skill to hone is the skill of observing. A great data analyst keenly observes two domains: 1) the business (or organizational) domain, and 2) the data domain. Learn to pay close attention to what is happening around you, and learn to pay close attention to what is in the data.
Additionally, they go to the “gemba,” a Japanese term meaning “the real place”— so that they can directly observe where and how the data is created.
Practice the following 6 Principles of Observation:
- Get close to the SOURCE of the data
- Slow down, breathe, and be MINDFUL
- Minimize distractions and FOCUS
- Look at it from multiple PERSPECTIVES
- Write down your thoughts in a JOURNAL
- Be aware of cognitive fallacies and BIASES
Becoming aware of our biases
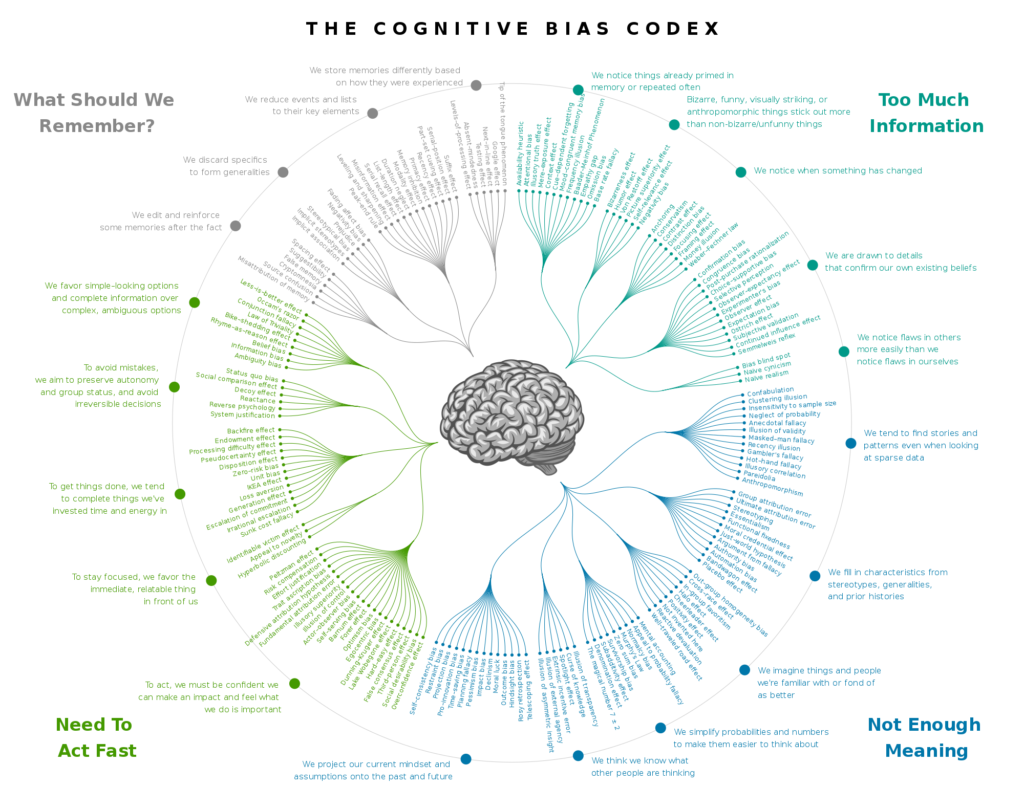
Before we dive into data analysis, it’s important to recognize that our minds come preloaded with shortcuts—mental habits known as cognitive biases—that can subtly distort how we interpret information. The Cognitive Bias Codex, a visual map of over 180 known biases, shows just how easily our thinking can be influenced without us realizing it. Becoming aware of these biases is the first step toward overcoming them.

Case-Studies of Common Cognitive Biases
Let’s dive into a few common biases in more detail:
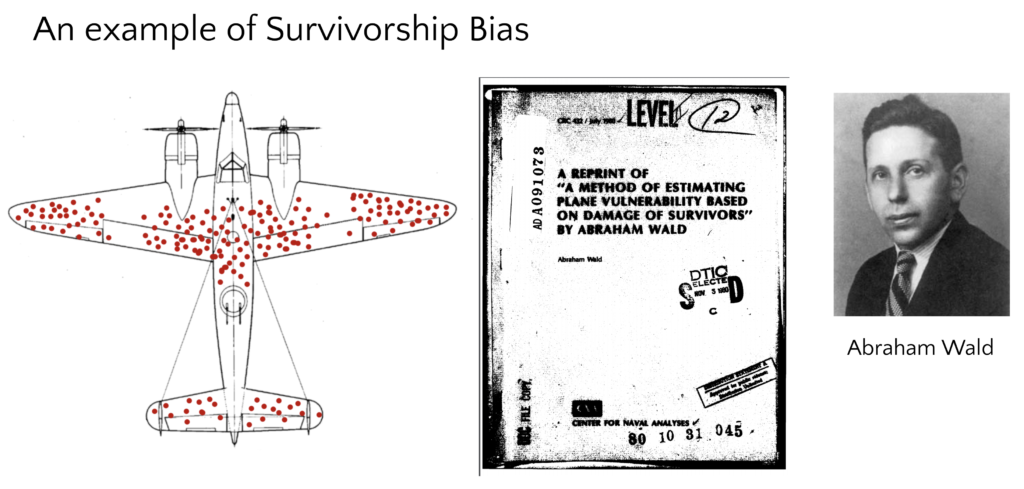
A common mistake where we focus only on people or things that have succeeded or made it through a selection process, and we overlook those that did not. This happens because failures or unsuccessful examples are usually less visible. As a result, we can end up drawing incorrect conclusions because we’re not seeing the full picture.
For example, in World War II, American researcher Abraham Wald realized that planes returning from missions with bullet holes didn’t need extra armor in those damaged spots; instead, the planes that didn’t return to the base likely got hit in critical areas without armor. In other words, the damage he could see represented survivorship bias—he needed to protect the places without bullet holes, because planes shot there never made it back.

Confirmation bias is when you tend to look for, notice, and remember information that matches what you already believe, while ignoring or discounting evidence that challenges your existing beliefs.
For example, in 1986, NASA officials decided to launch the Challenger shuttle despite engineers’ concerns about cold weather impacting o-ring safety seals. Managers selectively interpreted past launch data, focusing on successes and dismissing clear warnings about low-temperature risks. This is confirmation bias—seeing only the evidence that supports a desired decision, and ignoring data that challenges it. The tragic outcome highlighted the danger of allowing confirmation bias to influence data-driven decisions.
Availability bias is when we judge the importance or frequency of something based on how easily it comes to mind—often influenced by recent events or memorable stories—rather than actual data. And when you’re working with data, availability bias can show up by causing you to give more attention or importance to the data that’s easiest to access, most recent, or most familiar—rather than the data that’s most relevant or complete.
In early 2020, health officials relied heavily on limited testing data that focused on people with severe symptoms of COVID-19. Because mild and asymptomatic cases weren’t being tested, early analyses overestimated the virus’s fatality rate and underestimated its spread. This is availability bias in action—analysts drew conclusions from the data that was easiest to get, not the data that fully represented the situation.
Surrogation happens when someone becomes overly focused on a metric or number, forgetting that it’s only an imperfect representation of something more important. By fixating on that number, they lose sight of the real goal or bigger picture.
In one case study, Wells Fargo set aggressive targets for the number of accounts each employee should sell, using that metric as a stand-in for customer satisfaction and business success. Over time, employees became so focused on hitting those numbers that they opened 3.5 million deposit and credit card accounts without customers’ consent. This is a classic example of surrogation—the company lost sight of its real goals (trust, service, long-term growth) by overemphasizing a flawed metric (accounts opened), leading to unethical behavior and public scandal.
Step 1.1: Ask a worthwhile question
“If you do not know how to ask the right question, you discover nothing.” –W. Edwards Deming
When you learn to keenly observe your environment, what you notice will pique your curiosity, and interesting questions will naturally surface. A great data analyst knows how to sift through the questions that arise and find the ones that are the most worthwhile to answer. In order to differentiate between a question that is worthwhile and one that is not, you must be aware of the real-world context.
The power of the question was known to ancient greek philosophers. In his classic 4th century BCE work, Nicomachean Ethics, Aristotle laid the groundwork for the “Septem Circumstantiae,” or, the elements of circumstance. In today’s journalism schools, it is taught as “The 5W’s (and 1H)” – Who, What, When, Where, Why, and How?
While these questions can yield helpful insights, they’re also somewhat general. A great data analyst knows how to convert these questions into a form that’s more well-suited to data. We have developed a new model called “A Dozen ‘Hows’ to Ask Your Data.” These 12 question types can be used by themselves or in combination with each other:
- Cardinality: How Many? –basic counts of items
- Measurement: How Much? – measurements or multiple readings
- Tendency: How Typical? – means (averages), medians, or modes of quantities in our data
- Distribution: How Varied? – spread as measured by range, standard deviation, or variance
- Part-to-Whole: How Comprised? – breaking down quantities into categorical groups
- Time-Based: How Variable? – how the data has been changing over time
- Comparative: How Similar? – how two or more entities or groups compare to each other
- Correlation: How Related? – how two quantities might be correlated with each other
- Proximity: How Close? – the relative location of entities or groups in our data
- Network: How Connected? – linkages between individual “nodes” in our data
- Probability: How Likely? – what might happen in the future based on projections
- Causal: How Responsible? – cause-and-effect relationships in our data
Step 1.2: Form a guess or hypothesis
“I have steadily endeavoured to keep my mind free so as to give up any hypothesis, however much beloved (and I cannot resist forming one on every subject), as soon as facts are shown to be opposed to it.” –Charles Darwin
Once you’ve articulated your worthwhile question, the next step is to make a guess about the answer you think you’ll find, and to formulate a hypothesis about the explanation for this answer. This step is often skipped, but it’s important because it will reveal to you some of your biases and preconceived notions. Keep in mind that your hypothesis must be falsifiable; that is, it needs to be at least theoretically possible to prove it wrong. Otherwise, there’s no point in testing it.
Just be careful! We human beings tend to try very hard to prove ourselves right. As soon as you come up with a guess, a part of you will want to do whatever you can to verify it. But keep in mind: if your hypothesis proves to be correct, you merely confirmed what you already knew. If, on the other hand, your hypothesis proves to be incorrect, then you’ve really learned something – a “Eureka!” moment.
There are three different types of hypotheses to consider – basic, statistical, and scientific:
Three Types of Hypotheses
A basic hypothesis is the most common type of hypothesis you’ll use in everyday scenarios in business and in life: it’s simply your guess along with your best explanation. For example, if you’re curious which of two countries had a higher life expectancy last year, you might guess that country A was higher than country B because it had a higher Gross Domestic Product (GPD) last year, and economic prosperity, you reason, should correlate with longer life spans.
You might be right, and you might be wrong, but it’s important to avoid a common trap: when you create your hypothesis, don’t turn a singular statement into a general statement. A singular statement applies to particular things or individuals at particular times, while a general statement refers to something far more universal and far-reaching:
- SINGULAR VERSION: “Country A had a higher estimated life expectancy than Country B in 2024, because it also had a higher GDP that same year.”
- GENERAL VERSION: “Country A has a higher life expectancy than Country B, because it has a higher GDP.”
The key difference lies in the tense of the verbs (“had” versus “has”) as well as the inclusion of parameters (e.g. 2024) that anchor the statement to specific things, times, and places. Why does this matter? Because you want to avoid overgeneralizing.
When you find yourself in a situation in which you’re applying inferential data analysis, then you’ll want to use a statistical hypothesis instead of a basic hypothesis. A statistical hypothesis is a special type of hypothesis that applies any time you’re generalizing findings about a sample (or, a subset of a population) to the full population itself. When you’re working with sample data, the measures you compute are called statistics. And when you’re working with data from a full population, such as in a census, the measures you compute are called parameters.
When does this occur? Whenever you can’t get data from everyone or everything, such as with a survey or a quality control sample taken at random.
In such cases, you’ll actually be dealing with two different hypothesis:
- NULL HYPOTHESIS, H0: the statement that whatever change or difference you observe in the sample data is due to chance alone, and that in reality there is no difference. You will assume this statement to be true unless you can come up with enough evidence to justify rejecting it.
- ALTERNATIVE HYPOTHESIS, Ha or H1: the statement that that the observed change or difference isn’t due to random sampling error alone, but rather due to the fact that the sample wasn’t taken from the same population at all.
EXAMPLE:
Let’s say you work for a company that produces light bulbs and you want to test if a new manufacturing process results in bulgs that last longer on average than the current process. You can’t test every single light bulb ever produced, so you randomly select a sample of 100 light bulbs made with the new process and measure their lifespans.
Your statistical hypotheses would be:
- NULL HYPOTHESIS, H0: The new manufacturing process does not result in longer-lasting bulbs, and any difference observed in the sample is purely due to chance. In statistical terms, the mean lifespan of bulbs made with the new process is equal to the mean lifespan of bulbs made with the old process.
- ALTERNATIVE HYPOTHESIS, Ha or H1: The new manufacturing process results in longer-lasting bulbs, meaning the observed difference is significant and not just random sampling error. In statistical terms, the mean lifespan of bulbs made with the new process is greater than the mean lifespan of bulbs made with the old process.
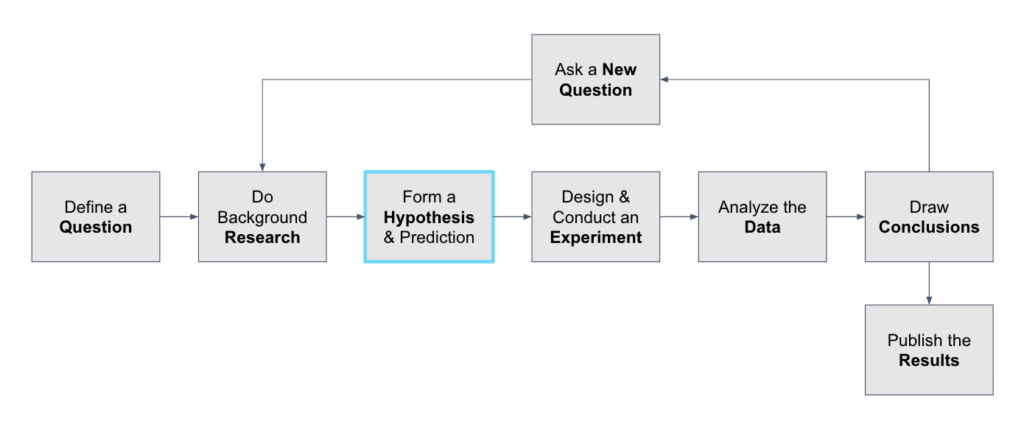
The scientific method involves formation of a hypothesis and a prediction – an educated guess about what the outcome of the experiment will be, along with a rationale, often rooted in a scientific theory. Bold scientific theories often take the form of general statements, because science seeks to discover the laws of nature itself, not just properties of specific instances or single specimens.

DECIDE: Do you have the relevant data?
Welcome to your first fork in the road! You’ve arrived at the first decision step in the process, indicated by the rhombus shape in the flow chart that reads, “Do you have the relevant data?” Relevance here is defined by your data’s relationship to your hypothesis: if your data is sufficient to test your hypothesis, and answer its underlying question, then it is relevant. If not, then your data isn’t relevant to the question at hand.
How you answer the question inside the decision shape determines where you go next! If the answer is “Yes,” and you already have relevant data, then you’ll move ahead to the SHAPE Phase, which we’ll cover in the next lesson. If the answer is “No,” and you DON’T already have relevant data, then you’ll proceed to the next step in the WONDER Phase, as explained below.
Step 1.3: Find & gather data or create it yourself
“Data! Data! Data!…I can’t make bricks without clay.” –Sherlock Holmes (The Adventure of the Copper Beeches)
If you don’t already have relevant data to test your hypothesis and answer your question, you’ll either need to look for it and find it, or you will need to create it yourself. Being able to find relevant data is a critical skill in today’s corporate environment, because data sets can be disparate and difficult to track down and access.
To find relevant data, consider looking in the following places:
- a data catalog or web portal
- a cloud-based data repository
- a traditional relational database
- a data lake or data warehouse
- a shared drive containing CSV (comma-separated values) or other flat files
- a co-worker’s local hard drive (unfortunately)
Additionally, find out if the role of data curator has been assigned where you work. The role of the data curator, like a curator in a museum or art gallery, is to handpick and combine individual assets, to display them for people to find, and to introduce them to the meaning and value of what’s on display. A curator in a museum does this with pieces from the museum’s collections. A data curator does this with data from the organization’s various data sources.
Filtering out irrelevant data
Once you’ve located a data source, the next step is to filter it down to the rows and columns that actually help you test your hypothesis. In large datasets, most of the data is likely irrelevant to your specific question. That’s where SQL filtering comes in.
SQL (Structured Query Language) is a powerful tool used to extract only the data you need from a database. Here are four key components that help you filter effectively:
The SELECT statement is used to choose specific columns (fields) you want to see. If you’re only interested in product names and sales figures, don’t select the entire table.
The following query returns all product names and their associated total sales from a sales_data table:
SELECT product_name, total_sales
FROM sales_data;
The WHERE clause filters rows based on conditions. Use it to exclude irrelevant entries.
The following query returns only sales greater than $1,000.
SELECT product_name, total_sales
FROM sales_data
WHERE total_sales > 1000;
The IN operator filters a column by checking if it matches any value from a given list.
The following query filters the data to only include products in the ‘Electronics’ or ‘Books’ categories.
SELECT product_name, category
FROM products
WHERE category IN ('Electronics', 'Books');
Before writing a query, revisit your hypothesis and question. Ask: What data do I really need to answer this? Start small and build from there. It’s easier to add data than to untangle a bloated query.
Applying Generative AI Tools
During the WONDER phase, you’re laying the foundation for your analysis—making observations, crafting worthwhile questions, forming hypotheses, and identifying relevant data. Generative AI tools like ChatGPT, Claude, or Copilot can support these early steps in several helpful ways:
- Sharpening your questions: You can use AI to help refine vague or overly broad questions into more specific, data-friendly ones. For example, “Why are sales down?” can become “How has weekly sales volume changed in Region A vs. Region B over the past 6 months?”
- Exploring the “Dozen Hows”: AI can help you brainstorm which of the twelve question types (e.g., How many?, How similar?, How related?) best applies to your situation—and even suggest how to rephrase your question accordingly.
- Forming initial hypotheses: If you’ve noticed a pattern or trend, generative AI can help you craft a hypothesis statement that’s falsifiable and grounded in the specific context or timeframe of your question.
- Finding potential data sources: While you generative AI tool may not be able to fetch private or internal company data, it can suggest where to look (e.g., public datasets, data lakes, or system-specific tools), and what variables might be relevant to collect or request.
However, it’s important to approach these tools with a critical mindset. Generative AI models don’t understand your unique context the way you do. They may offer plausible-sounding suggestions that aren’t appropriate for your situation—or worse, reinforce your own assumptions if you’re not careful. To use AI responsibly in the WONDER phase:
- Treat outputs as thought-starters, not definitive answers
- Cross-check any suggestions against your real-world knowledge
- Watch for confirmation bias—AI might mirror the bias in your original prompt
In short, AI can help spark new ideas and clarify your thinking, but you’re still in the driver’s seat. Curiosity, context awareness, and thoughtful questioning remain your most powerful tools in the WONDER phase.
Knowledge Check
Click the accordions below to expand the question and answer.
Question #1
A data analyst believes that a recent drop in website traffic was caused by a new homepage design. They immediately begin collecting data to prove this, without considering other possible causes like a broken tracking script or seasonal trends. Which cognitive bias are they most likely falling into?
A. Surrogation
B. Availability bias
C. Confirmation bias
D. Network bias
Answer #1
Correct Answer: C
This is confirmation bias—the analyst is looking only for evidence that supports their initial belief, instead of objectively testing all possible explanations.
Question #2
You’re analyzing customer ages for a new product line. You want to understand the spread—from the youngest to the oldest—and whether most customers fall within a certain age range. Which “How” question are you asking?
A. Tendency – “How typical?”
B. Distribution – “How varied?”
C. Cardinality – “How many?”
D. Probability – “How likely?”
Answer #2
Correct Answer: B
This question is about the spread or variation in customer ages, which falls under Distribution – “How varied?”
Key Terms & Definitions
Hover over each card to flip it over and reveal its definition.
Gemba
A Japanese term meaning “the real place”—encouraging you to go to the source where the data is created.
Hypothesis
An educated guess that explains something you’ve observed, which can be tested and potentially proven false.
Falsifiable
A quality of a hypothesis that means it can be tested and possibly proven wrong.
Cognitive Bias
A mental shortcut or pattern that can distort thinking and lead to flawed analysis.
Survivorship Bias
Focusing only on the visible successes and ignoring failures that are no longer present.
Confirmation Bias
Seeking and favoring information that supports what you already believe.
Singular Statement
Also called a particular statement, this kind of statement refers to a specific case, limited to a particular subject, time, or context.
General Statement
Also called a universal statement, this kind of statement makes a broad claim intended to apply across all times, cases, or situations.
Sample
A smaller subset of a larger group (the population) that is selected for analysis, often to make inferences about the whole.
Population
The entire group of people, items, or events that you want to study or draw conclusions about.
Null hypothesis
The starting assumption in NHST (Null Hypothesis Statistical Testing) that there is no real effect or difference—any pattern you see in the data is likely due to random chance.
Alternative hypothesis
The claim in NHST (Null Hypothesis Statistical Testing) that there is a real effect or difference—the pattern in the data is meaningful and not just due to chance.
Further Learning
If you’d like to further your learning of the topics covered in this lesson, here are some resources for you to explore:
- Book – The Invisible Gorilla: How Our Intuitions Deceive Us (Chabris & Simons, 2011)
- Book – Inattentional Blindness (Mack & Rock, 2000)
- Article – BBC: “How ‘survivorship bias’ can cause you to make mistakes” by Brendan Miller (Aug 28, 2020)
- Article – Harvard Business Review: “Don’t Let Metrics Undermine Your Business” by Michael Harris & Bill Tayler (Sept-Oct 2019)
- Article – “A Simple Strategy for Asking Your Data the Right Questions” by Brent Dykes, Forbes (11 Aug 2020)
- Article – Discover Magazine: “How the 1919 Solar Eclipse Made Einstein the World’s Most Famous Scientist” by Devin Powell (May 24, 2019)
- Video – BBC Radio 4: Karl Popper’s Falsification (Aug 5, 2015)
- Blog Post – Tableau Blog: “Does your team need a data curator?” by Ben Jones (Dec 18, 2018)