1.1 Making Keen Observations
Topic Summary
Before you dive into your data, or even think about how to use it to answer your questions, it helps to stop and consider the way you observe the world around you. A couple points become clear: first, that you have amazing powers of observation. You take in information using your five senses, and you form conclusions about your world that help you accomplish great things. Second, however, it soon becomes obvious that your brain is susceptible to illusions and cognitive biases of various kinds. That’s true for everyone. We’re not perfect observers, by any means. In this first lesson, you’ll come face to face with your amazing and flawed powers of observation, and you’ll receive some tips to cut through the clutter and make even more keen observations going forward.
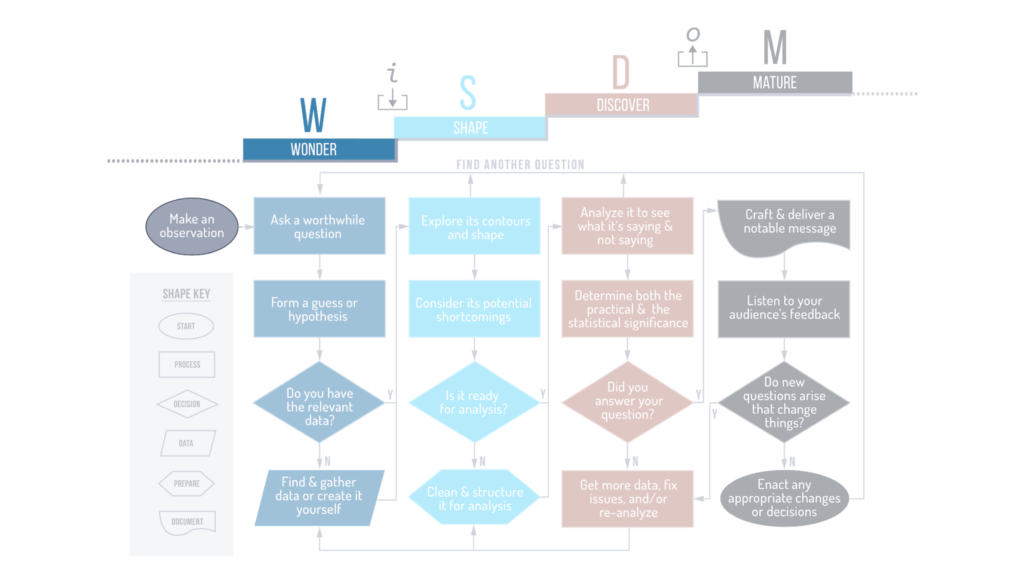
Where are You in the Flowchart?

Key Points To Remember
- We all have amazing powers of observation, but they are far from perfect and highly susceptible to flaws and biases of various kinds.
- To work with data, we need to learn how to keenly observe the data itself, the world around us, and ourselves.
6 Sound Principles of Observation:
- Get close to the SOURCE of the data
- Slow down, breathe, and be MINDFUL
- Minimize distractions & FOCUS
- Look at it from multiple PERSPECTIVES
- Write down your thoughts in a JOURNAL
- Be aware of cognitive fallacies & BIASES
Definitions
- incongruity – a violation of our perceptual expectations
- inattentional blindness – (also called ‘perceptual blindness’) “occurs when an individual fails to perceive an unexpected stimulus in plain sight, purely as a result of a lack of attention rather than any vision defects or deficits.” (Source: Wikipedia, accessed 07 June 2022)
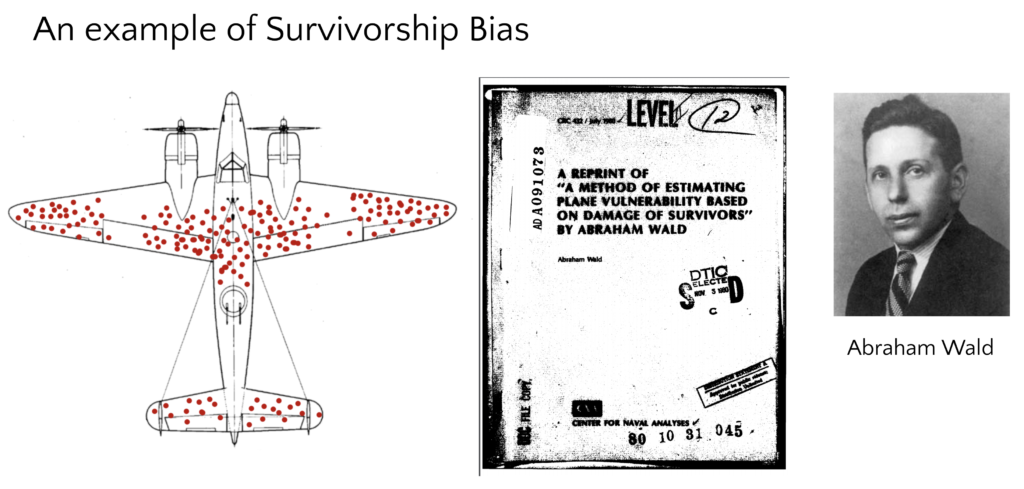
- survivorship bias – “the logical error of concentrating on the people or things that made it past some selection process and overlooking those that did not, typically because of their lack of visibility. This can lead to incorrect conclusions.” (Source: Wikipedia, accessed 07 June 2022)
- confirmation bias – “the tendency to search for, interpret, favor, and recall information in a way that confirms or supports one’s prior beliefs or values.” (Source: Wikipedia, accessed 07 June 2022)
- surrogation – in data, this happens whenever a person loses sight of something important by focusing too much on a metric that imperfectly represents it.
Diagrams


Course Project
Choose a topic of interest in your life for which you want to use data to learn or improve in some way. The topic of interest can come from any of the “3 Domains of Application” covered in the Data Literacy Fundamentals course – namely, professional, personal, or public.
- What are some of your key observations about this topic?
- What’s the source of your observations?
- What do you observe about yourself relative to this topic?
- What are your positive emotions (hopes, aspirations, joys, etc.) about it?
- What are your negative emotions (fears, concerns, woes, etc.) about it?
- What cognitive biases or perceptual limitations might be influencing you?
Quotes
“Nothing has such power to broaden the mind as the ability to investigate systematically and truly all that comes under thy observation in life.“
Marcus Aurelius, Meditations, Book III, 11
“You’re not going to develop a discerning eye unless you hone your ability to give something your full and undivided attention.“
Daido Moriyama
“Learn to see details. There is quite a difference between simply looking at a chart and seeing it. Looking is your first visual impression, while seeing involves the studying of distinct parts of the visual.“
Mary Eleanor Spear,
Further Learning
- Book – The Invisible Gorilla: How Our Intuitions Deceive Us (Chabris & Simons, 2011)
- Book – Inattentional Blindness (Mack & Rock, 2000)
- Article – BBC: “How ‘survivorship bias’ can cause you to make mistakes” by Brendan Miller (Aug 28, 2020)
- Article – Harvard Business Review: “Don’t Let Metrics Undermine Your Business” by Michael Harris & Bill Tayler (Sept-Oct 2019)
- Journal Article – Journal of Personality: “On the perception of incongruity: a paradigm” by Bruner, J. S., & Postman, L. (Dec 1949)
- Research Paper – “A Reprint of ‘A Method of Estimating Plane Vulnerability Based on Damage of Survivors” by Abraham Wald (July 1, 1980)
- Video – Daniel Simons: Selective attention test (Mar 10, 2010)
- Video – TEDxJackson: Missing what’s missing: How survivorship bias skews our perception by David McRaney (Feb 3, 2015)