1.4 Finding, Gathering, or Creating Data
Topic Summary
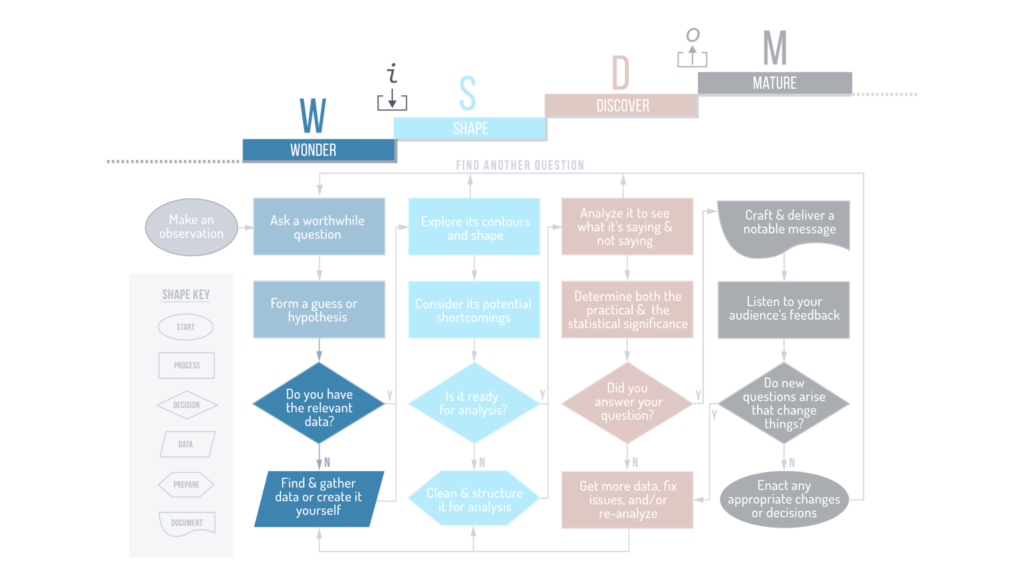
The next step in the process of converting data into wisdom is to ask whether you have the data you need in order to answer your question and put your hypothesis to the test. Sometimes relevant data has already been turned into a chart or dashboard for you by someone else. Oftentimes though, there’s no ready-made chart at your disposal and you find yourself rolling up your sleeves and getting your hands dirty with the raw data itself.
You may already have the raw data in your hands. Perhaps someone emailed you a spreadsheet, or you downloaded a csv (comma-separated values) file from the internet. If you’re lucky, you have access to raw data that’s stored in a well-designed and maintained database, or via an API (Application Programming Interface). Either way, if the answer to the first “Decision” step in the process is “Yes,” then you can proceed to the Shape phase.
Other times, though, you don’t have the data you need to answer your question and test your hypothesis. Perhaps you have no idea where the data might be found, or if it even exists at all. If so, you’ll proceed to the final step in the WONDER Phase: “Find & gather data or create it yourself.” In order to become proficient in the language of data, you’ll need to learn how to get your hands on raw data so that you can work with it, learn from it, and communicate it to others. If you can’t manage to get ahold of raw data, then you’ll hit a ceiling in your development.
This topic in the course provides some practical advice on how to go about getting your hands on data in a couple different situations – on the web and on the job. And then it covers how to select and filter a large data set down to just the relevant records and attributes using Microsoft Excel, SQL, and a web portal interface.
Where are You in the Flowchart?
Key Points To Remember
- When gathering data from the web, an off-the-shelf web scraping application like DataMiner.io or WebScraper.io, or a custom web scraping program such as one written using the Python “Beautiful Soup” library can be useful.
- For simpler situations where you simply need to connect a spreadsheet to a live, online data table, you can use built-in functions, such as:
- The =IMPORTHTML function in Google Sheets
- Syntax: =IMPORTHTML(“url”,”query”,index)
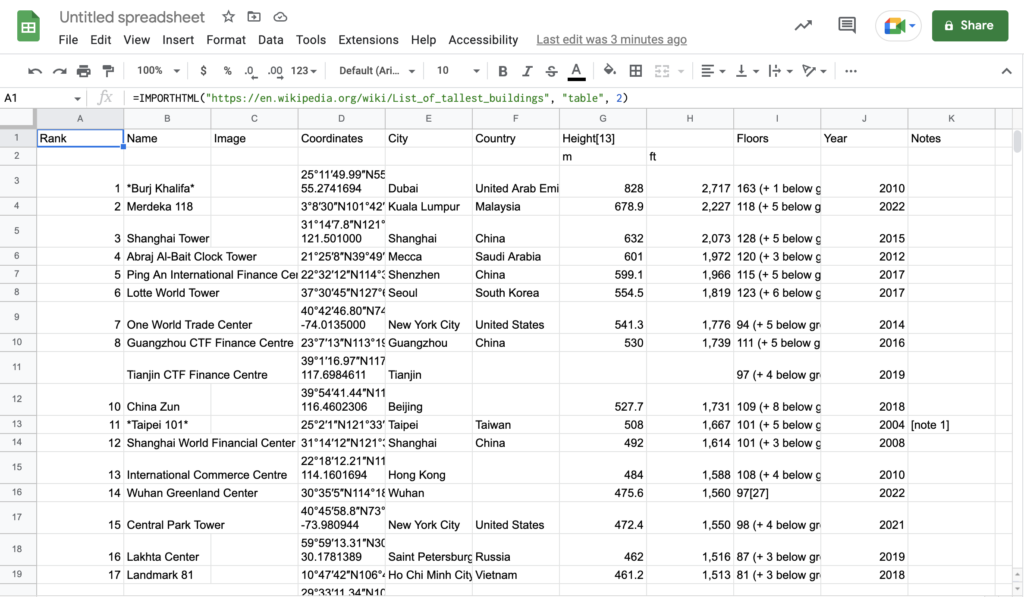
- Example: =IMPORTHTML(“https://en.wikipedia.org/wiki/List_of_tallest_buildings”, “table”, 2)
- The Get Data from Web function in MS Excel
- The =IMPORTHTML function in Google Sheets
- If you’re struggling to find data in a corporate environment, consider turning to either a data curator or a data catalog for help getting access to the data you need.
- If you want to limit a data set to just what’s relevant to your question, then you’ll need to perform one or both of the following actions:
- Selecting the attributes/columns that you want to include in your analysis.
- Filtering the records to exclude the ones you don’t need, and including the ones you do need to test your hypothesis.
- You can use many different data tools and technologies to select and filter a data set down to just the relevant data, including MS Excel, SQL, web portals, visual analytics softwares, programming languages, and more. The good news is that you don’t have to learn them all. You just have to know how to use at least one of the tools that would work in a given situation.
Definitions
- data curator – a person within an organization who’s intimately familiar with many data sets and their respective uses. The data curator hand-picks and combines individual assets, displays them for others to find, and introduces them to the meaning and value of what’s on display.
- data catalog – a data catalog is a platform or service that organizes data sources for its users, making them more visible and accessible. It also provides important metadata that explains where the data came from and what the terms, acronyms, and units of measure actually mean.
Tool Tutorials
To follow along with this tool tutorial, first create a free account at data.world, a cloud-native data catalog that we use to share files and examples. Then, go to the Data Literacy Level 2 On Demand project space. Click “Launch workspace” in the upper right corner to open a workspace where you can see shared data files and SQL queries.
Google Sheets: How to gather data from a website using IMPORTHTML
Overview: In this tutorial, you’ll learn how to import data from a table on a website into a Google Sheets spreadsheet. The data in the spreadsheet will be “live,” meaning that if the table on the website changes, so will your spreadsheet. The data table you’ll import is found on the Wikipedia page titled “List of tallest buildings.”
You’ll need a free Google account to do so. If you don’t already have a free Google account, go to google.com, click “Sign in,” and then click “Create account” and “For myself.”
Step 1 – Start a new spreadsheet
- From your Google account, navigate to Google Sheets and then click the “+ Blank” icon in the “Start a new spreadsheet” section.
- Alternatively, from Google Drive (while signed in to your account) click “+New” and then choose “Google Sheets.”
Step 2 – Import data table into the spreadsheet
- Select cell A1 in the top left corner of the spreadsheet so that there’s a blue outline box around it.
- Type the following into cell A1: =IMPORTHTML(“https://en.wikipedia.org/wiki/List_of_tallest_buildings”, “table”, 2) and then click the Enter or Return key. Note that the function has the following three inputs:
- The website URL itself, including http:// or https://, surrounded by quotation marks. This is the site that Google Sheets will crawl to import the data.
- The query “table” or “list”, also surrounded by quotation marks. This parameter will cause the crawler to either look for a <table> tag or a <li> tag in the HTML of the page.
- An index that returns the nth table or list on the site. A value of 1 returns the first table or list on the page, a value of 2 returns the second, and so on. This can be helpful if the web page has more than one table or list. In our example of the world’s tallest buildings, the data table itself happens to be the second table on the page, counting from the top down.
Step 3 – Review imported data table
- Take a look at what now appears in your spreadsheet. Compare this version of the data with the original version of the data in the website, and note any differences between the two tables.
Step 4 – Title spreadsheet
- In the top left corner of the browser window where it says “Untitled spreadsheet,” give your spreadsheet a title such as “List of tallest buildings from Wikipedia.”
Excel: How to gather data from a website using Get Data from Web
Overview: In this tutorial, you’ll learn how to import data from a table on a website into an Excel spreadsheet. As of the date of creation of this tutorial (July, 2022), this feature is only available in Excel for Windows, not Excel for MacOS. The data table you’ll import is found on the Wikipedia page titled “List of tallest buildings.”
Step 1 – Open a new blank spreadsheet
- With Excel open on your desktop, go to File > New.
Step 2 – Import data from the web into Excel
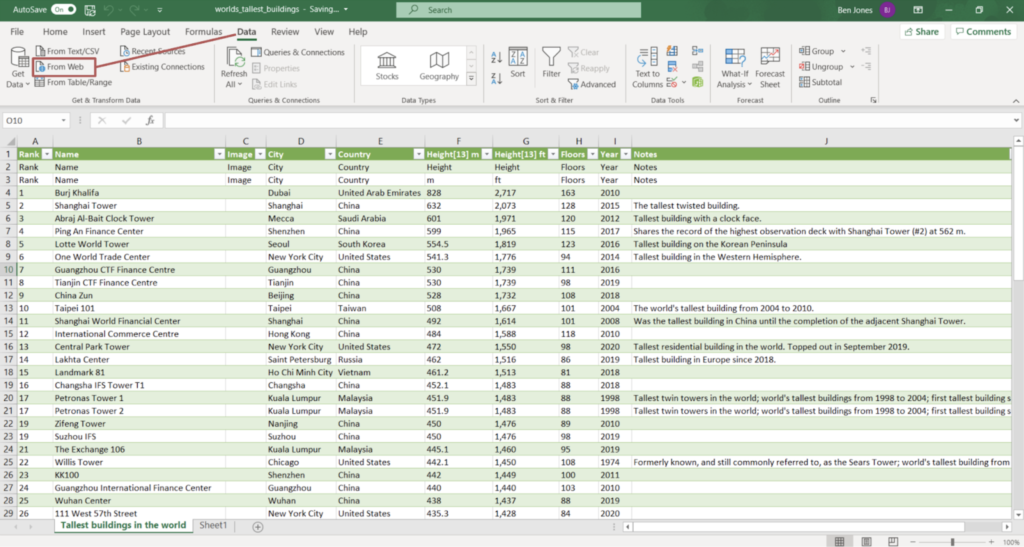
- Click the Data menu in the top ribbon tool bar, and then select “Get Data (Power Query)” and then choose “From HTML.”
- Enter the following Wikipedia page URL into the window that appears: https://en.wikipedia.org/wiki/List_of_tallest_buildings
Step 3 – Review the resulting data table in Excel as shown here:
Step 4 – Refresh the table to show the most recent version
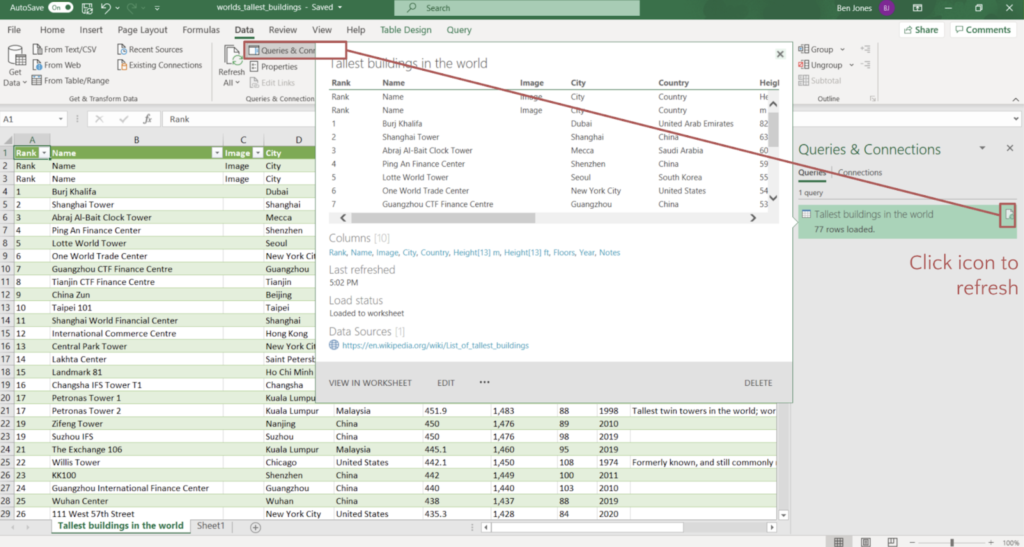
- Note that this table will not automatically update if the original data table on the website changes. To refresh the data table to make sure that it is showing the current version of what’s on the web, take the following steps:
- In the Data tab across the top menu, click “Queries & Connections” and then in the corresponding panel on the right of the screen that appears, click the icon next to the table name (“Tallest buildings in the world”) to refresh it:
Excel: How to use the Filter feature to filter a data table
Overview: In this tutorial, you’ll use Excel’s Filter feature to show a selection of just a couple rows and columns. To follow this tool tutorial, download the World Bank country population Excel file titled “API_SP.POP.TOTL_DS2_en_excel_v2_2764317.xls” from the course workspace on data.world (or, if you prefer, get a fresh version of the same data from the source site here). Open the downloaded file in Excel, click on the “Data” tab, and find populations for over 200 countries starting in 1960.
- Step 1 – Define your filter and select criteria
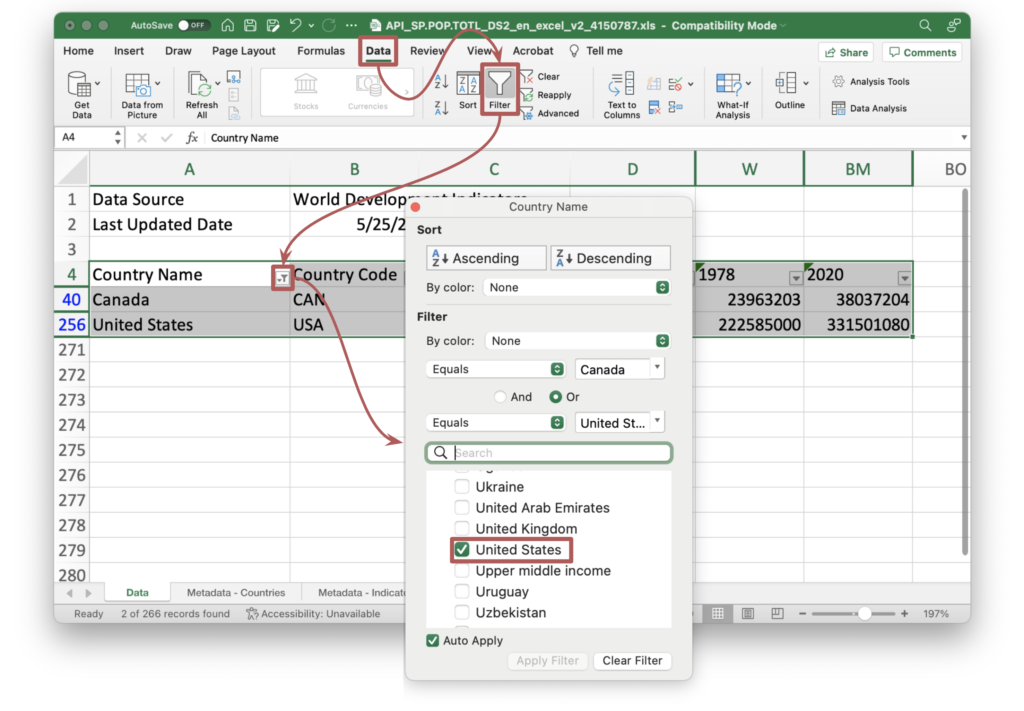
- Your goal is to filter the data table to just show populations for years 1978 and 2020, and only for Canada and the United States. You’re looking to answer a question about which country’s population grew the most over that time.
- Step 2 – Select your columns using Hide
- Hide all of the columns for the years you don’t need to see in order to answer your question. To do so, right click on the topmost column header letter (e.g. “E” for column E that contains data about the year 1960) and then click “Hide.” These columns will no longer appear on the screen.
- Step 3 – Filter the table using the Filter feature
- Select the entire data table (not the top 3 metadata header rows) by clicking on cell A4 (the “Country Name” column header) and then holding down either Command+Shift (for Mac) or Ctrl+Shift (for Windows) along with the right arrow key and then the down arrow key.
- With the population data table selected, click on the “Data” menu at the top of the window, and then click on the “Filter” icon in the ribbon across the top. Notice the small down arrows that appear in each of the column header cells.
- In the “Country Name” header cell, click the small down arrow in the bottom right corner of the cell, uncheck the “(Select All)” option in the filter window, and then check only the boxes next to “Canada” and “United States“.
- You should now see a table with populations for Canada and the United States in 1978 and 2020 – the only data points that are relevant to your question.
- Step 4 – Obtain the answer to the original question
- Use the filtered data table to answer the question: “Which country grew more in population between 1978 and 2020?”
- Think of more than one way to answer this question using these data points.
SQL: How to Filter a Data Table using SELECT & WHERE Clauses, and ON & IN Operators
Overview: In this tutorial, you’ll use the SQL capabilities built into the data.world online data catalog to show a selection of a couple rows and columns from a larger data table in order to answer a specific question that you have. For this tutorial, you’ll need a free account on the data.world platform. You can create an account by going to data.world and then clicking “Sign in” and then “Join now.”
Once you have created a free account on data.world, go to the Data Literacy Level 2 On-Demand project space on data.world. Click “Launch workspace” to open a workspace where you can see shared data files and SQL queries.
Step 1 – Find the data table you’ll use
- Notice that the workspace contains a data file named “World_Bank_Country_Population_1960-2020.xls.” This file contains a single table titled “population” that resembles the Excel file downloaded from the World Bank Data website, except the three header rows at the top have been deleted, making it easier to directly query the table.
Step 2 – Create a query to return the entire table
- Click +Query in the workspace to create a new SQL query within the workspace.
- In the SQL editor in the center of the screen, enter the following text, click “Run query,” and then notice that the entire data table is returned in the query results area below the query text:
SELECT *FROM population p;
- Note that when you use the asterisk (*) after SELECT, you are telling the query to return ALL of the columns in the data set, so you need to be careful with it! In general, it’s best to specify just the columns you want in your table. Also notice that the table name, “population,” appears after FROM, and that the query specifies an “alias” for the table, the letter “p,” that will serve as a nickname that will come in handy in later queries where you are referencing multiple tables.
Step 3 – Modify your query to only include specific columns in the resulting output table
- Let’s try it again. This time you’ll modify the query to select and return only three columns from the data table: the columns for country_name, and the columns for the population in 1978 and 2020:
SELECT p.country_name, p.`1978`, p.`2020`FROM population p;
- Once you’ve entered the query above, click “Run query” again in the top right corner.
- Note that it’s poor database practice to use a number like 1978 for the name of a column. Some databases don’t allow it, in fact. In order to successfully run the query, you need to surround the numbers 1978 and 2020 with what’s called the “grave accent.” It’s this character: `, and it can usually be found in the top left corner of the keyboard underneath the esc key, on the same key as the tilde character: “~”
Step 4 – Modify your query again to only include rows that meet a specific set of conditions
- Let’s modify and rerun the query again, this time using the WHERE Clause along with the OR Operator to filter the table to only return rows for Canada and the United States:
SELECT p.country_name, p.`1978`, p.`2020`FROM population pWHERE p.country_name = 'Canada'OR p.country_name = 'United States';
- Note that instead of using the OR Operator to specify both country names, you could use the IN Operator to create a set of values, like this:
SELECT p.country_name, p.`1978`, p.`2020`FROM population pWHERE p.country_name IN ('Canada','United States');
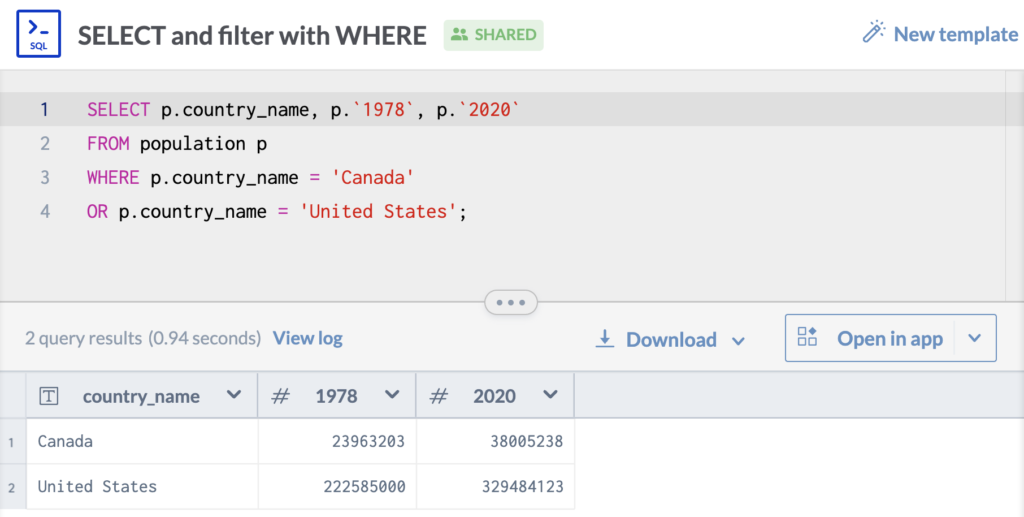
Step 5 – Review the resulting output table
- Regardless of whether you use OR or IN in the query (we recommend you try it with both!), take a moment to review the output table:
| country_name | 1978 | 2020 |
| Canada | 23,963,203 | 38,005,238 |
| United States | 222,585,000 | 329,484,123 |
Step 6 – Obtain the answer to the original question
- Use the selected and filtered data table to answer the question: “Which country grew more in population between 1978 and 2020?”
- Think of more than one way to answer this question using these data points.
Course Project
Look at your observation, question, and hypothesis, and ask yourself if you have data that will help you put this hypothesis to the test and answer your question.
- If so, then congratulations! You can skip to the next step – you’re headed to the SHAPE Phase.
- If not, then you’ll need to get your hands on some good data to proceed.
- Is there a data set that already exists that you can access? Then do so!
- Do you need to select or filter records to just what’s relevant? Then use whatever tool you can use to get data that’s relevant to your inquiry.
- Is it a data set that doesn’t exist that you’ll need to create? Then do so!
- If it’s sample data, then make sure your samples are representative of the population from which they are being drawn. Eliminate any sources of bias and use a sample size that’s as large as is feasible given the time and budget constraints you’re working with. Shoot for a sample size of no less than 30.
- Is there a data set that already exists that you can access? Then do so!
Quotes
“Data! Data! Data!…I can’t make bricks without clay.”
Sherlock Holmes, in Arthur Conan Doyle’s The Adventures of Sherlock Holmes (London: George Newnes Ltd, 1892)
Further Learning
- Blog Post – Tableau Blog: “Does your team need a data curator?” by Ben Jones (Dec 18, 2018)
- Blog Post – TDWI: “The Rise of the Data Curator” by Kelly Stirman (Jan 26, 2018)
- Online Tutorial – SQL Select, WHERE, OR, and IN, W3 School
- Online Tutorial – Filter data in a range or table, Microsoft Excel Tutorial
- Online Tutorial – IMPORTHTML, Google Docs Editors Help
- Online Tutorial – Import data from the web, Microsoft Excel & Training
- Online Data Portals:
- United Nations Data, UNdata – data.un.org
- US Federal Government – data.gov
- US Census Bureau – census.gov
- EU Open Data Portal – data.eurpoa.eu/en
- UK federal government – data.gov.uk
- Asian ADB Data Library – data.adb.org
- Our World in Data – ourworldindata.org
- World Bank Open Data – data.worldbank.org
- OECD Data – data.oecd.org
- UNICEF Data – data.unicef.org
- WHO Global Health Observatory – who.int
- Google Public Data Explorer – google.com/publicdata/directory
- FiveThirtyEight Data – data.fivethirtyeight.com
- Awesome Public Datasets on GitHub – github.com/awesomedata/awesome-public-datasets