
Lesson 1: Insight
Learning Objective
In this iteration, you’ll define your story’s purpose, gather potential insights, and align with stakeholders on the story’s context and goals.
By the end of this lesson, you will be able to:
- Set the purpose of your data story.
- Build a backlog of potential insights, visuals, and metrics.
- Align early with colleagues or subject matter experts to stress-test the insight.
Core concept
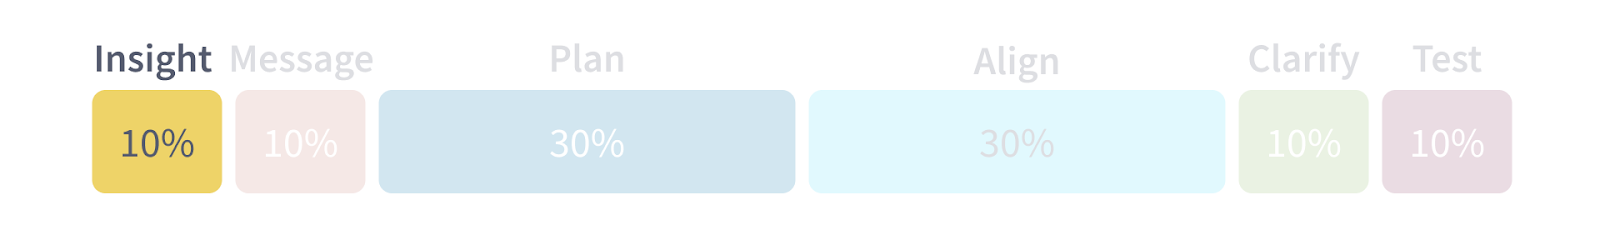
This iteration should take you about 10% of your total project time.
First, define the purpose of your data story. Are you looking for…
- a decision to be made
- an action to be taken
- simply to share information
Knowing the purpose of your data story will help you align every part of your story to achieve the outcome you need. Mark down your answer in your Data Storytelling Workbook (download it in the Introduction lesson). We’ll keep this in mind throughout the entire project.
In this first iteration through the framework, we’re only going to tackle the I and T.
We’ll define the insight that you want to base your data story on, and then test it.
Insight
Create a list of datasets, metrics, or charts you already have that you think might be useful to you in this project.
For example, if you’re trying to optimize your company newsletter to lead to more sales, then you might have on your list things like:
- open rate
- click through rate
- unsubscribe rate
- all these metrics over time
- which emails led to sales
It’s helpful to list out everything you have available first—don’t overthink it, we’ll whittle this list down in a minute
Add any insights or observations that you’ve made using these datasets, metrics, or charts.
Maybe you noticed a pattern in your newsletter subject lines or the time of day that the newsletter is opened the most. You may notice that some datasets or metrics haven’t helped you glean any insights yet.
That’s ok; just take note of that and keep them on the list. You may need them later.
Look through your list of insights and circle the top two or three that directly support your goal.
At the beginning of this project, you defined the goal or purpose of your data story: action, decision, share information. Now you want to circle a couple of insights that will help your listener achieve that goal. We don’t need ALL our data and insights in our data story. We want to keep it focused. We can always come back to this list later.
With our newsletter example, our insight gleaned from open rate and CTR is that readers were clicking the most on our custom graphics. So those are the metrics that we’ll circle since they’re integral to the decision we want to be made after our data story.
We now have a purpose (decision, action, information sharing), a few metrics, and an insight or two to test. So now it’s time for the T: Test. We need to test that this insight is meaningful. Is it worth sharing with our data story listener?
Test
The goal of this testing is to pressure-test your insight(s). Poke holes in it. Strengthen it. If it doesn’t hold up, go back to your list and see if another metric would help strengthen your insight, or maybe you need to explore a new direction entirely. The stronger your insight, the stronger the story you’ll build around it.
Identify a colleague or subject matter expert who can help test whether your chosen metrics and insights make sense. Often, we only have part of the story or limited expertise, so it’s always worthwhile to get a second pair of eyes
- What context might I be missing?
- Could there be other explanations?
- Is this insight clear?
- Would it lead to a decision or action, if that’s what I need?
Did they suggest another metric to look into? Maybe they were unclear what your insight was or suggested another metric to explore. You may need to go back to your list of metrics and insights. Use their feedback to refine or pivot before moving forward.
Let’s see these steps in action with a real example about our newsletter at Data Literacy that’s been slightly fictionalized to be told in comic form with Becky and Fern…
In action with Becky & Fern


Your next steps
Here’s what you should accomplish in the first 10% of your project time:
- Define the Purpose of Your Data Story
- What do you want your data story to accomplish? Are you aiming for a decision to be made, an action to be taken, or to share information clearly? Your answer will guide every step that follows.
- Identify Datasets and Metrics
- List out all the datasets, metrics, and charts available to you.
- Add Insights Gleaned from Each
- For each dataset, metric, or chart listed, add any insights that you’ve discovered using each one.
- Prioritize
- Circle the top 2–3 insights that best support your data story’s purpose.
- Test
- Find a colleague, stakeholder, or subject matter expert to review your chosen insight. Ask:
- What context might I be missing?
- Could there be other explanations?
- Is this insight clear? Would it lead to a decision or action, if that’s what I need?
- Use their feedback to refine or pivot before moving forward.
- Find a colleague, stakeholder, or subject matter expert to review your chosen insight. Ask:
✨AI Prompt Tip✨
Use an AI chatbot to help you brainstorm potential insights from your data. This can help spark ideas you may not have considered and give you a head start before prioritizing and testing your insights.
Be sure not to enter any sensitive company information without approval. Check your company’s AI use policy.
Try this prompt:
I’m creating a data story and the purpose is: <Your Purpose—decision, action, or sharing information>. Here’s a list of metrics and charts I have available to use: <insert list>.
Based on this, what possible insights or patterns should I explore that could support my goal? Are there any other metrics you think would be useful for me to find an insight?
Knowledge check
Click the accordions below to expand the question and answer.
Question
Scenario: You’re testing your insight with a subject-matter-expert and they say, “This is interesting, but I don’t think there’s anything we can do to fix this problem…”
Question: What should you do next?
Answer
Revisit the purpose of your data story (decision, action, share information). If an action isn’t possible, what kind of decision would need to be made to make progress toward an action? Was your goal to simply share this information anyway? If an action isn’t possible, make sure your goal or purpose is still attainable.
Key terms
Hover over each card to flip it over and reveal its definition.
Data Story
A sequence of graphics that forms a cohesive narrative.
Dashboard
A collection of charts that help you monitor a situation.
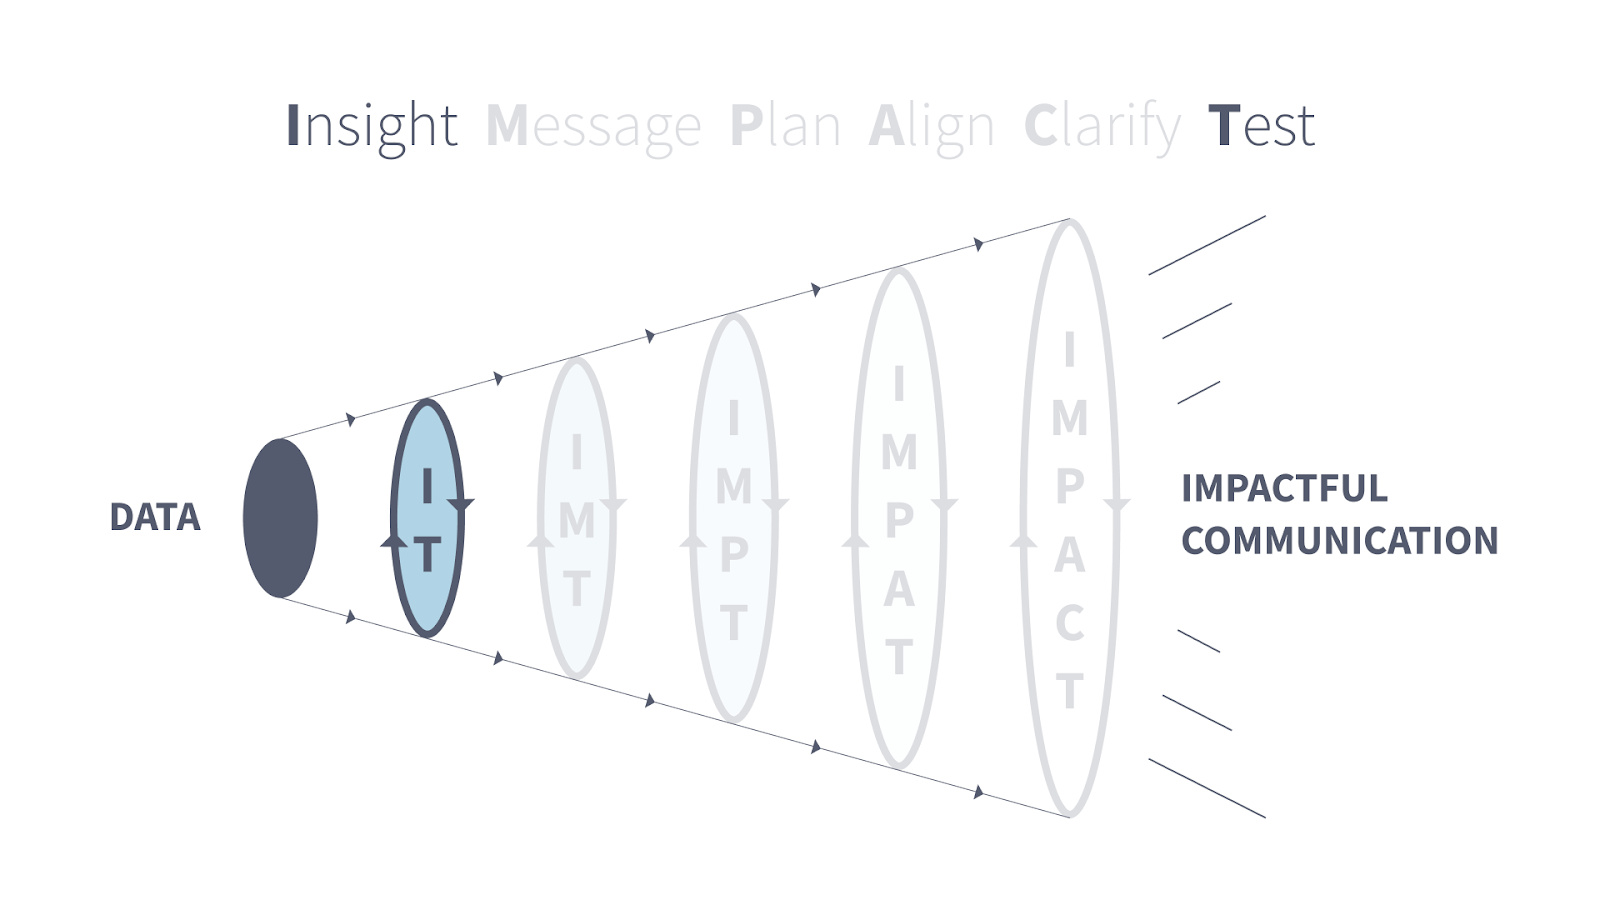
IMPACT acronym
Insight, Message, Plan, Align, Clarify, Test
Insight
Gaining a new perspective on a problem.
Further Learning
Here are additional resources to deepen your understanding of this topic:
- Podcast: How to find a meaningful insight using the WISDOM framework (The Data Literacy Show)
- Article: Dashboards are Not Data Stories (The Data Visualization Society’s Nightingale Journal)
- Video: How to Explore the Contours of Your Data (Data Literacy’s YouTube channel)