
dbt Charts: Better Data Graphics with AI
By Ben Jones, Co-Founder and CEO of Data Literacy
Here's a confession: I've built more dashboards with AI in the past year than I'd care to count. Some of them were pretty good. A few of them I'd rather you never saw. And I'd hate to be the data team that has to maintain all of them.
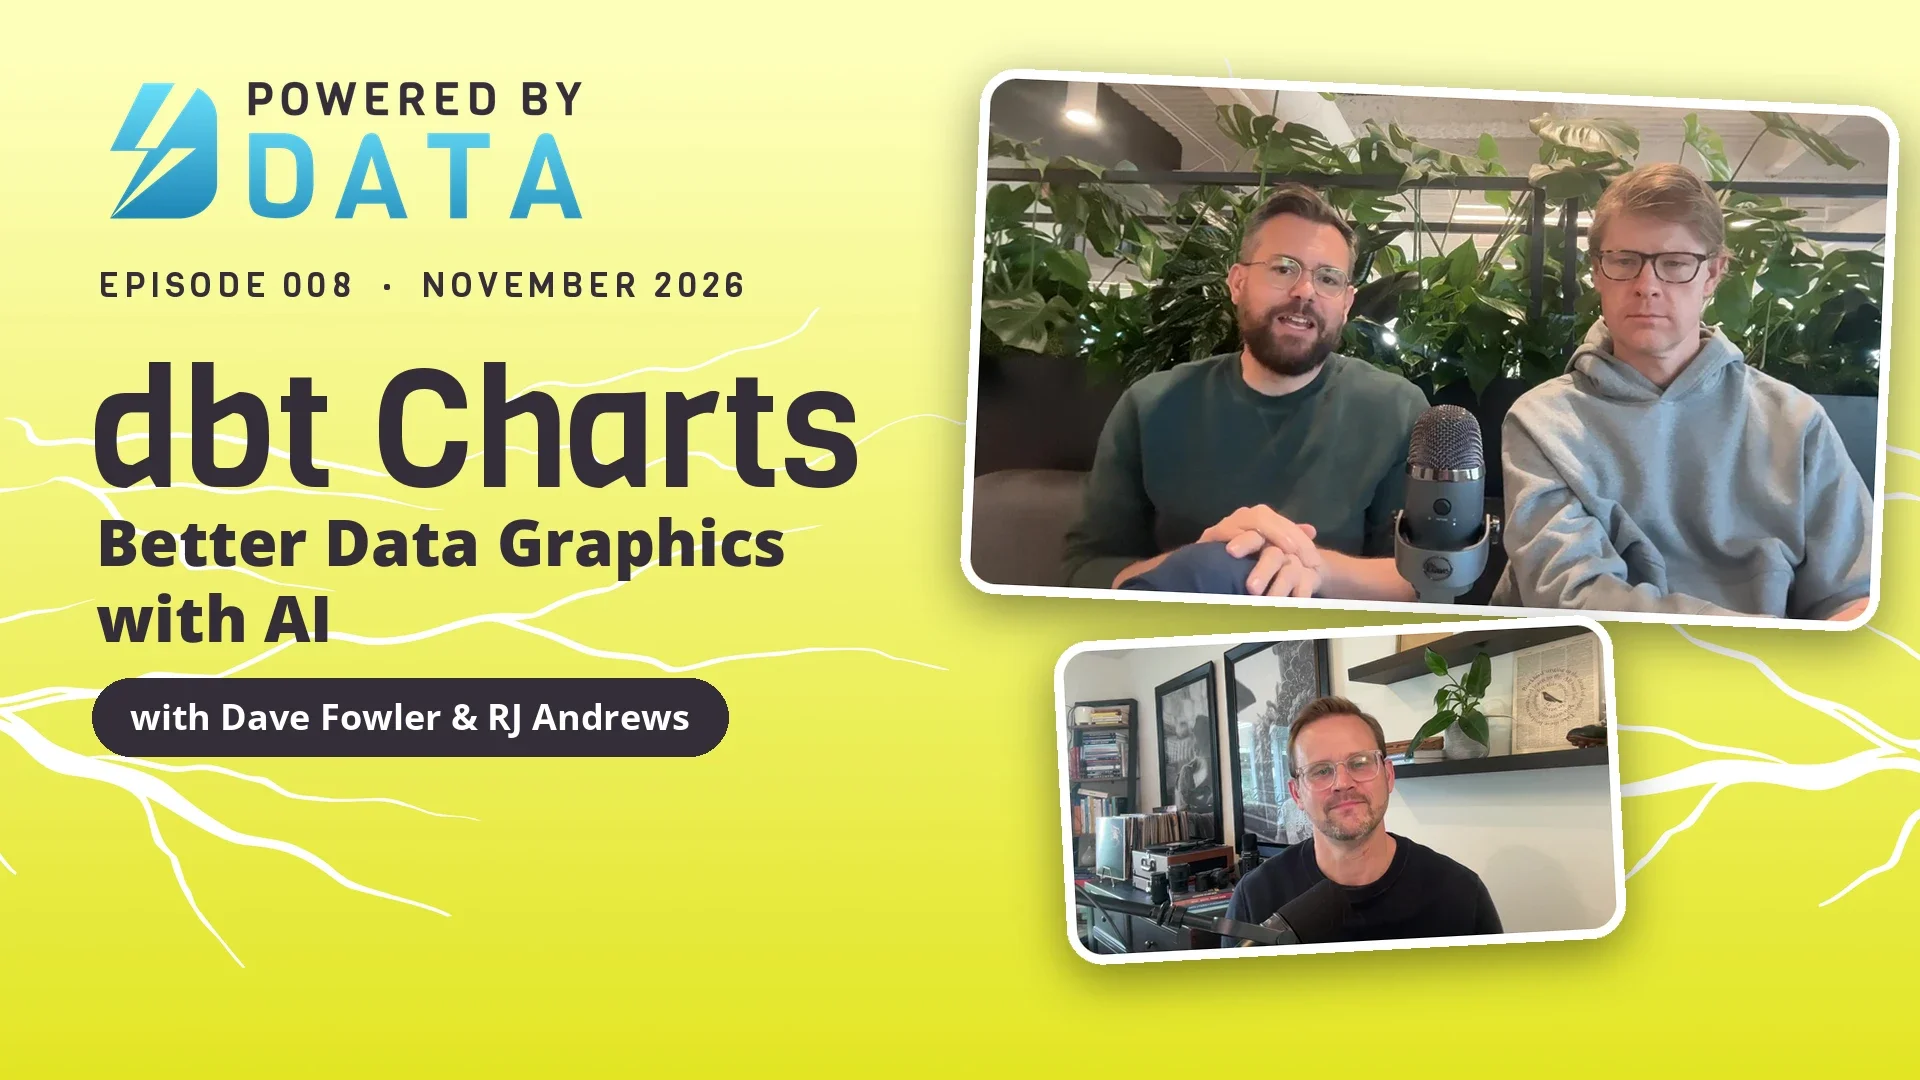
That's the exact problem dbt Charts sets out to solve, and I got to talk it through on the latest episode of the Powered by Data Show with two people I admire a great deal. I've long been a fan of Dave Fowler's work, going back to when he founded Chartio, which was acquired by Atlassian. Today he leads Charts at Fivetran. RJ Andrews is the author of Info We Trust, and a close friend of mine. We've been geeking out about charts together for years.
An open standard for dashboards
Ask an agent for a dashboard today and you'll get one. What you won't get is consistency. One dashboard is a pile of JavaScript, the next is Python, each uses a different charting library, and they're all hosted somewhere different. Nobody can audit that, so nobody fully trusts it.
Dave's answer is to give the agent better rails to run on, and to make those rails open to everyone. dbt Charts is an open-source, declarative language for dashboards, or as Dave puts it, "a markdown for dashboards." SQL describes what data you want. dbt Charts describes how you want to see it. Every dashboard is a plain YAML file that sits in a charts folder right next to the models folder in your dbt repo. So when someone renames a column upstream, every chart that depends on it gets checked on the same branch, before anything ships. No more hunting down the 20 dashboards that quietly broke.
What struck me most is that the team isn't trying to lock anyone in. They're trying to set a standard. It's the same playbook that made dbt itself so popular: an open-source core that anyone can use for free, plus a paid hosted platform for teams who want the extras. Dave pointed out that you can already host these dashboards inside Streamlit, and said he'd love to see Anthropic and OpenAI adopt the format for the charts their AI tools create. Having watched Tableau Public do something similar for a whole generation of chart makers, I think that openness is exactly right. A shared language is something a community can build on.
Centuries of data graphics, built into the defaults
When I was in San Francisco recently, I had dinner at RJ's home. His office there has become a veritable museum of the history of data graphics. (He's careful not to call them "data visualizations.") There are books and prints from the past few centuries and from all over the world. In one of those books, I found this page from a Japanese statistical publication from the early 1930s, titled "Military Conscription Examination Results and Naval Recruitment Results."
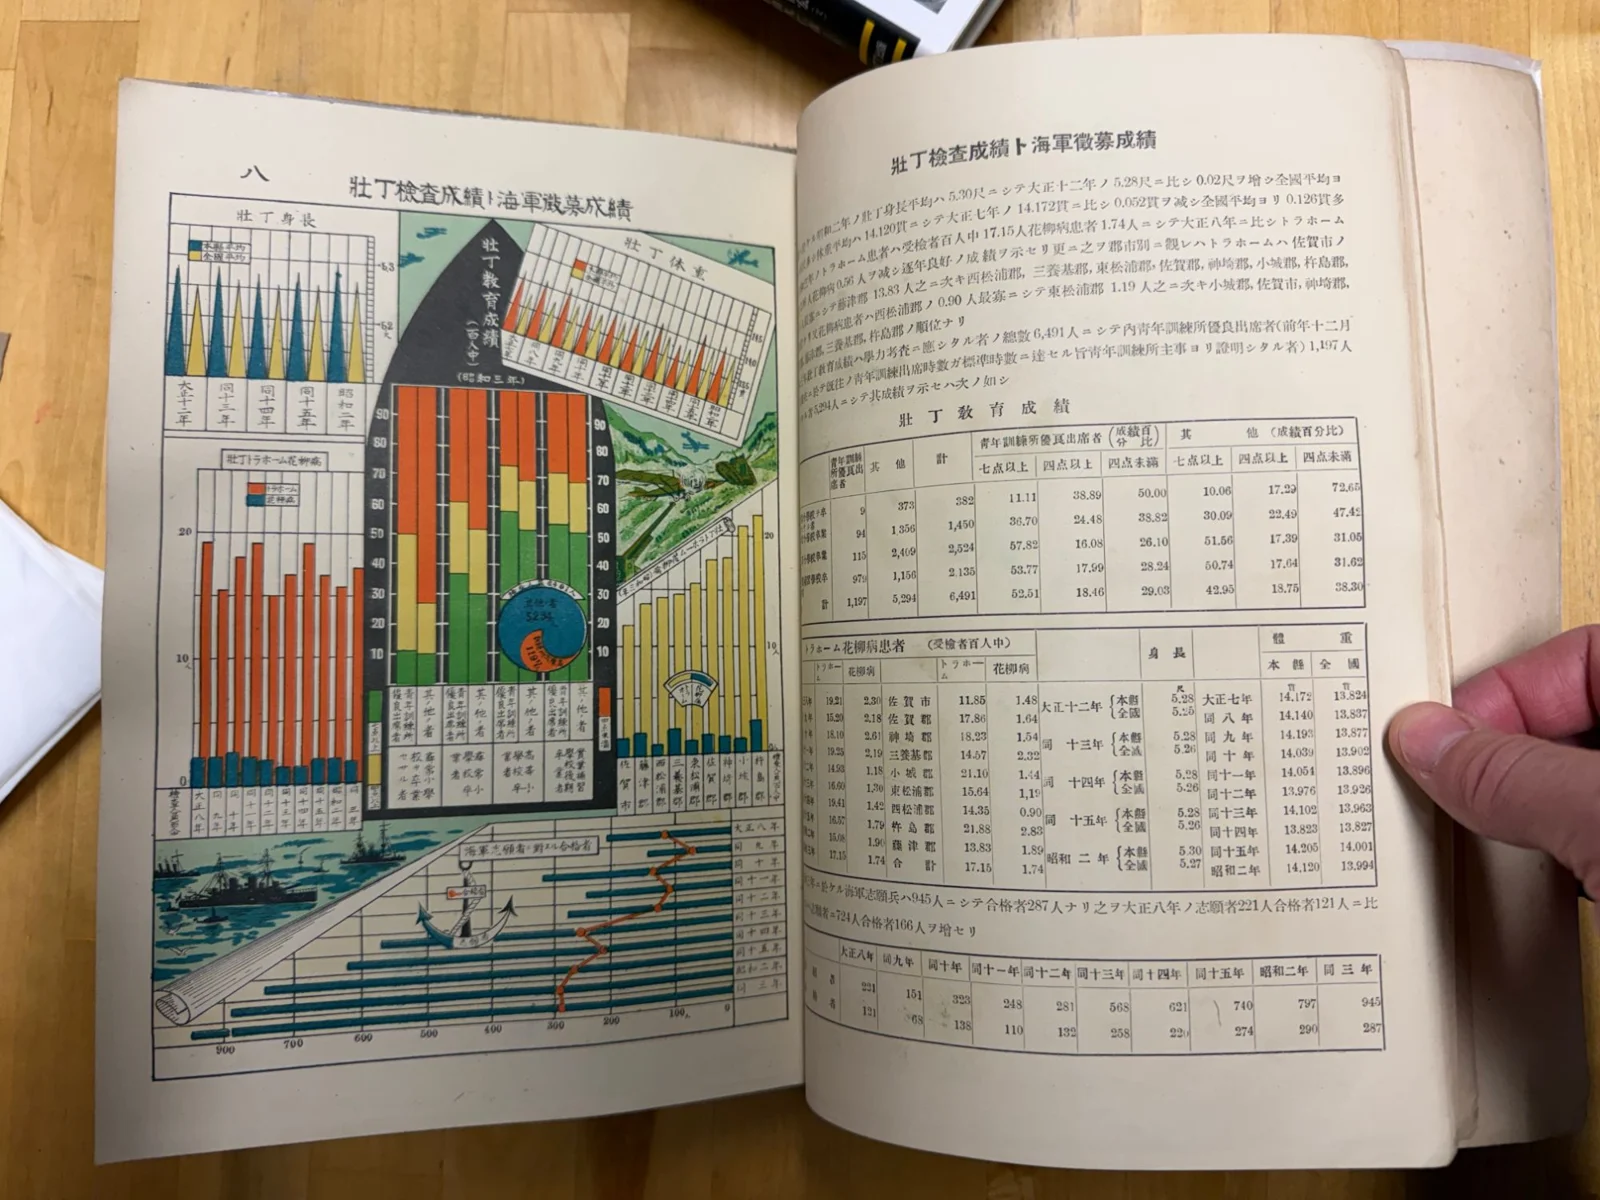
"Military Conscription Examination Results and Naval Recruitment Results," from a Japanese statistical publication of the early 1930s, in RJ Andrews's collection. Photo: Ben Jones.
Look at all the different ways the designer found to show the numbers, and how much fun they had doing it. RJ has steeped himself in this history, and now he's looking for ways to bring what it teaches about effective graphs into the open standard that dbt Charts is creating.
One example he gave on the show was a chart like this one, from a Soviet publication of the late 1930s. Take a look at the year labels along the bottom.
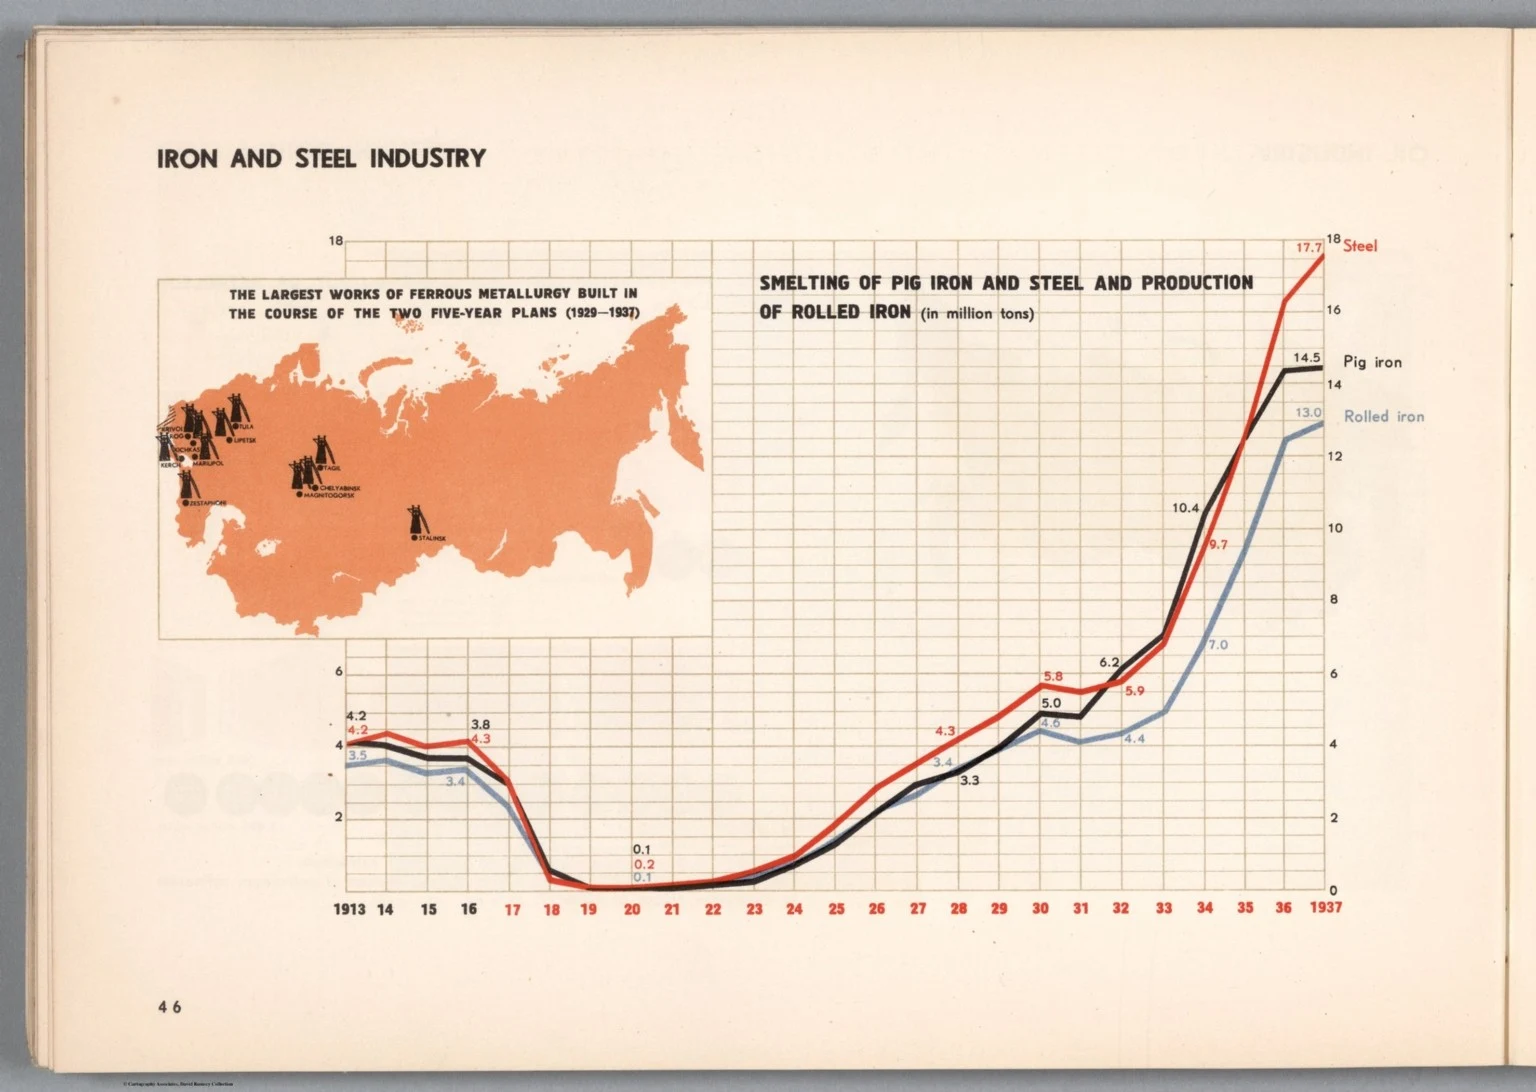
Source: David Rumsey Map Collection, © Cartography Associates.
The years 1913 through 1916 are in black. From 1917, the year of the Revolution, every label turns red. That's it. There's nothing technically marvelous about changing a color. But the axis is doing some of the talking, and it fits the data perfectly.
Now, let's be honest: this is propaganda. And I'd be remiss, given the book I wrote, if I didn't point out that a chart this persuasive deserves a skeptical read. But as a design lesson, it's terrific. RJ's point is that the plain line graphs and bar charts our executives actually read could be working much harder than they usually do. And they shouldn't need a design genius to get there. dbt Charts builds lessons like this into its defaults, and because it's an open standard, any team can override those defaults with its own theme.
RJ also said something about AI that I haven't been able to shake. Nobody wants to hear about the chat you just had with an AI agent. It's like telling someone about your dreams. Charts, on the other hand, are a social technology. If the exploration we do with AI is going to matter to anyone else, it has to end in something we can share and trust.
Behind the scenes: when the data breaks the chart
Here's a design problem I bet you've run into. You have a bar chart where one bar is a true outlier, way taller than all the others. Scale the axis to fit it, and every other bar gets squashed flat at the bottom. Cut it off, and you've hidden the most important number on the chart.
RJ gave me a peek behind the scenes at how the dbt Charts team is tackling this one, and I want to share it with you, because it says a lot about this group of dedicated enthusiasts and how seriously they take the craft.
The designers of old had a playful answer: let the data break right through the chart. RJ shared this example with me, from a little pamphlet called Transactions of the Society of Calligraphers. It charts the "percentage of excellence in the physical properties of books published since 1910," and the line plunges so far that it tears through the bottom of the frame and splits the caption in two.
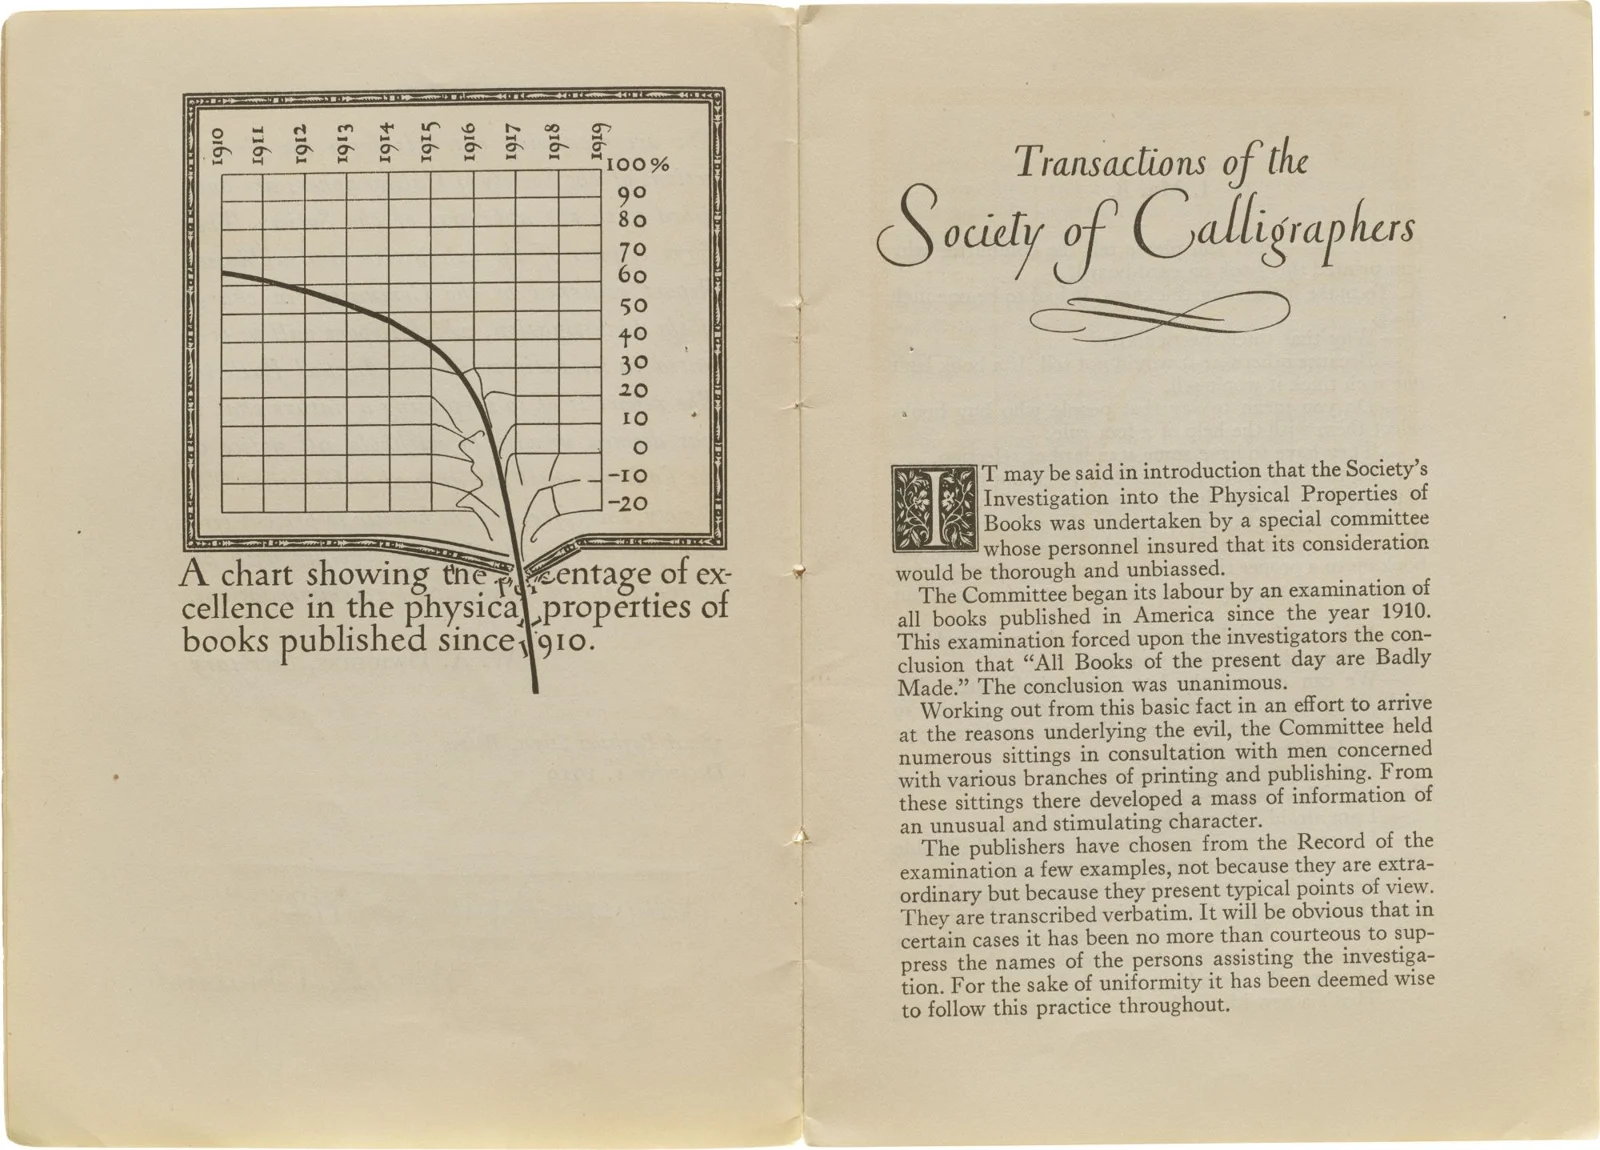
From Transactions of the Society of Calligraphers, shared by RJ Andrews.
I love that. It's funny, it's memorable, and you can't miss the point. Back at the dbt offices, the team is working out how to give that same freedom to everyone, for a bar that breaks the axis because it really is off the chart. Here's a photo RJ shared from one of their whiteboard sessions.
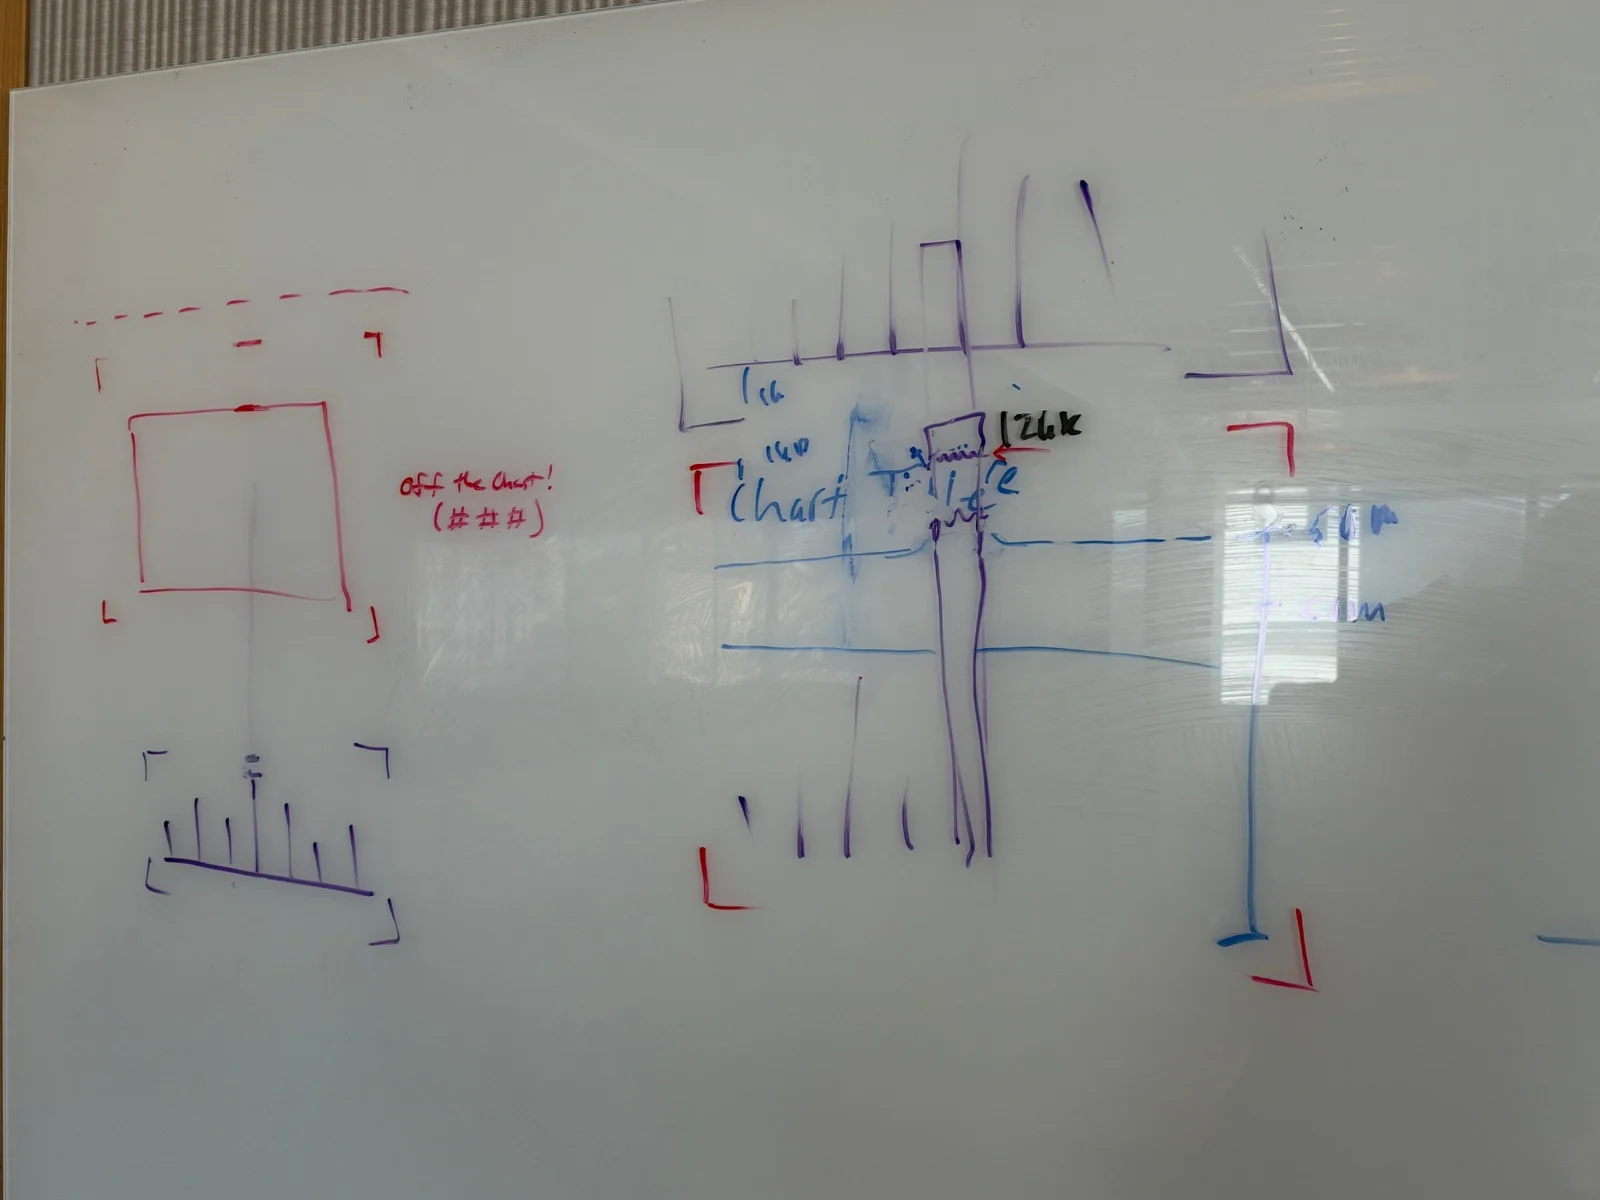
The dbt Charts team working out how a bar can break the axis. Photo: RJ Andrews.
What struck me is how RJ described the shift in his own work. When he designed a single chart, he only had to decide how that one breaking bar should look. Now he has to design a system. When should a bar be allowed to break through? Should it ever be the default? What if two bars break through, or both pieces of a stacked bar? Should the tool give a warning, or some guidance? That's the hard part of turning the history of the craft into an open standard: every clever idea has to work for everyone, every time.
My first dbt Charts dashboard
I couldn't host the episode without trying it myself. I grew up in Los Angeles, so earthquakes have always fascinated me. I have a GitHub repo that pulls data from the USGS every hour and writes it to a Supabase database. I pointed Claude Code at it and asked for a dashboard in the free version of dbt Charts. You can explore the live dashboard here.
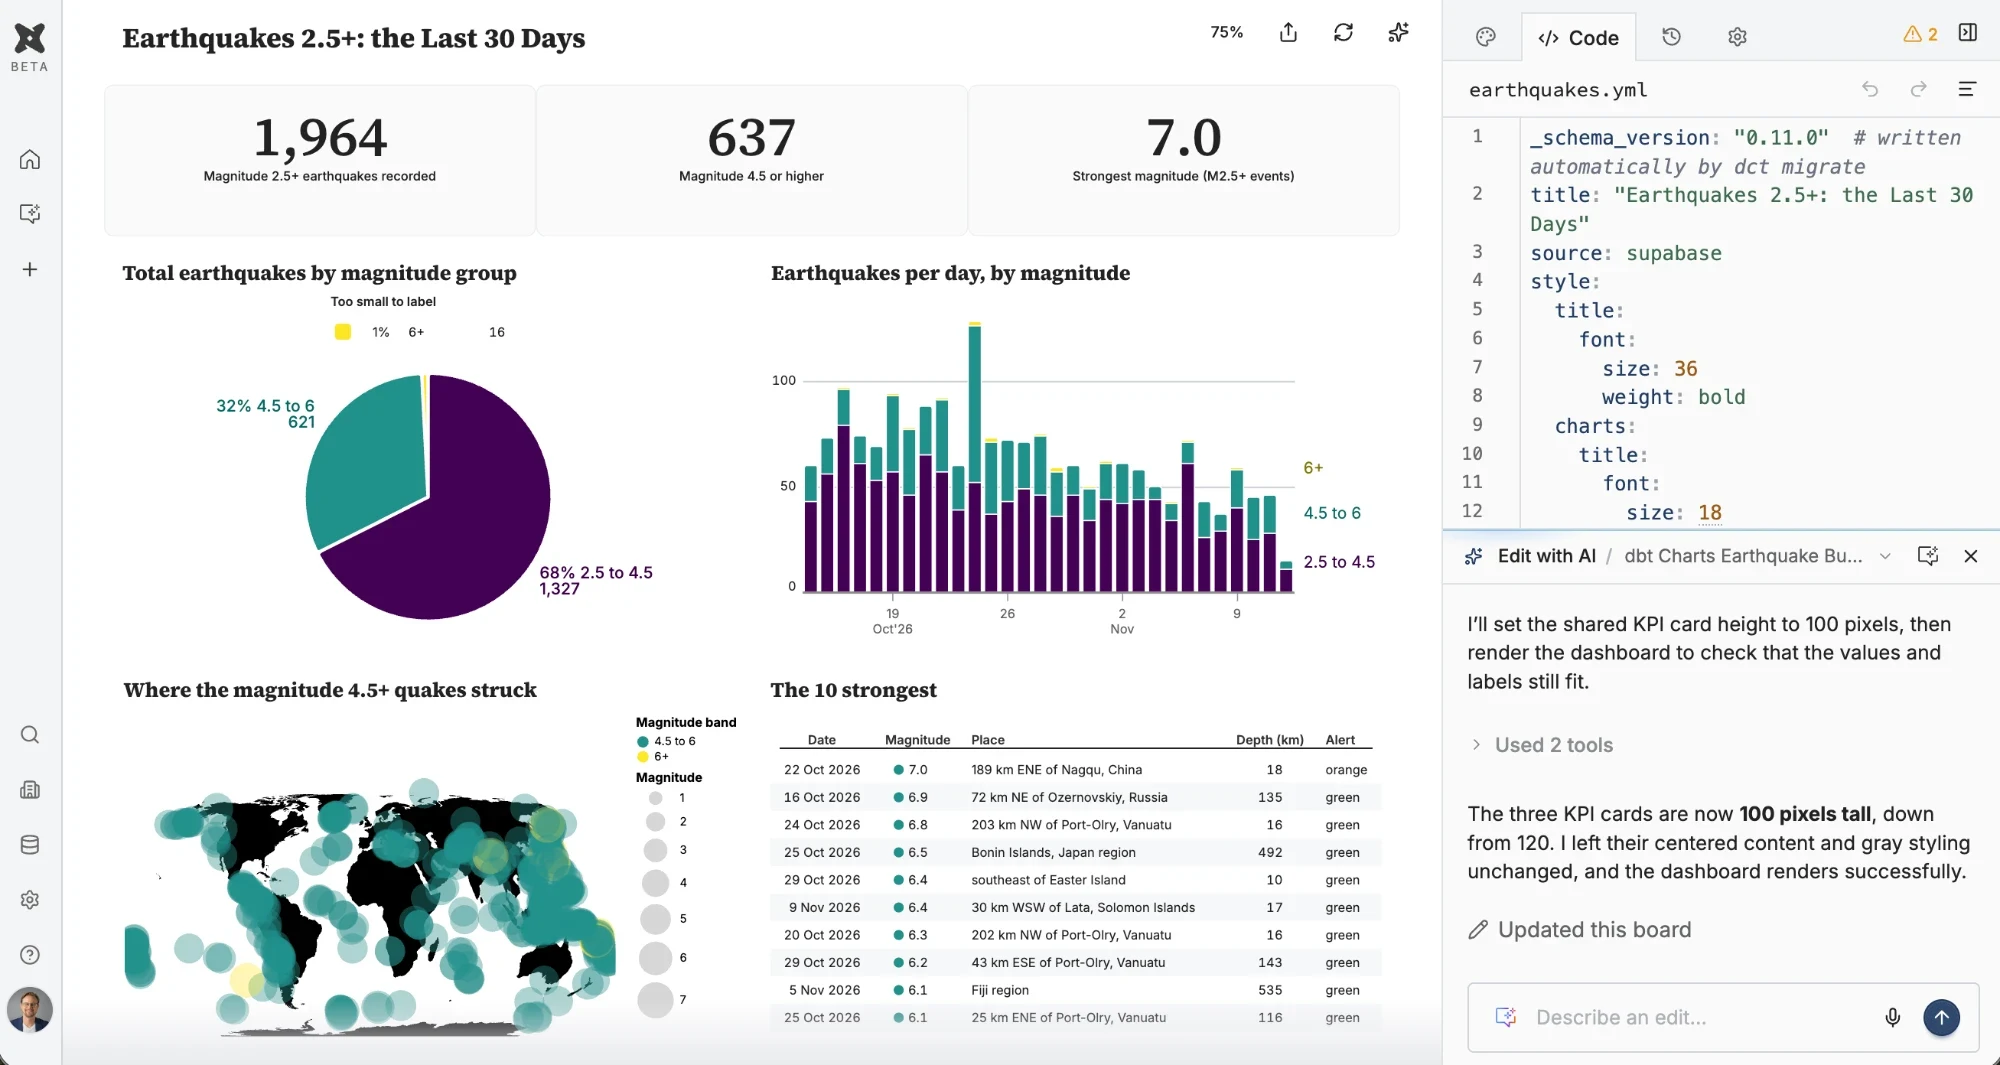
I made a few changes through the chat: a Viridis palette, a pie chart it hadn't given me the first time, and some restyling of the KPI cards. Notice the panel on the right. The whole dashboard is that one YAML file, so Claude, the editor and I are all working from the same spec. And version history comes for free, because it all lives in Git.
Is it perfect? No. RJ took one look and said my map's bubbles need some love. Fair enough. And Dave challenged me to stop playing it safe with a nice, standard BI dashboard and try some charts that break the rules. Challenge accepted.
Try it yourself
dbt Charts is free for teams of up to three. Start at dbtcharts.com, where there's a prompt you can paste into Claude or another agent to get set up, or follow the Getting Started tutorial. The full episode page has chapters and a complete transcript.
And if you'd like your team building charts and dashboards that people actually trust, with AI or without it, that's exactly the kind of work we love to do.
Enjoyed this post?
Get new posts and practical ideas for working with data and AI in your inbox.
Training your team on this?
Live workshops led by Ben Jones and on-demand courses with an AI Coach, for teams of 10 or more.
See team training optionsKeep learning
Explore the full library of data and AI literacy courses, with an AI Coach to guide you.
Browse courses