
Find Out Where Your Team Stands: The Data Literacy Score and the AI Literacy Score
By Ben Jones, Co-Founder and CEO of Data Literacy
We created the Data Literacy Score in 2020, out of necessity. As our clients planned their data and AI literacy training, the same question kept coming up: how will we know if this is working? Completion rates and satisfaction scores would tell them people had shown up and liked it, but not whether anything had changed. The assessment gave them a baseline, taken before the training started, that they could measure progress against. It turned out to be useful for much more than that. It surfaced the gaps and pain points holding teams back, giving leadership clear targets for their broader efforts to build a more data-informed culture.
Nearly 4,800 people have taken it since. Some organizations run it before a training program and again afterwards, and plenty run it on its own. Sometimes a whole department takes it, and sometimes it's a sample of people from across the organization. Either way, everyone answers the same questions anonymously, and leadership gets a report on where the group is strong and where it struggles.
Until now, every one of those engagements went through us. We set up the survey, sent the link, pulled the results into a spreadsheet, and built the report by hand. That worked, but it meant a team had to talk to us before it could find out where it stood.
Starting today, you can run it yourself. And there's a second assessment alongside it: the AI Literacy Score.
What they measure
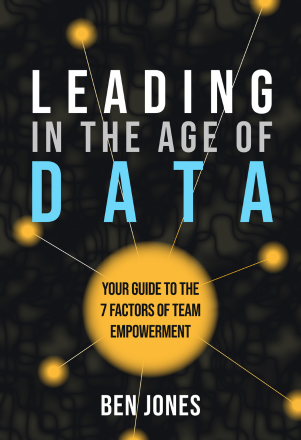
Both assessments ask people to rate 50 statements about their team on a scale of 0 to 10, for a score out of 500. The statements are grouped into seven factors, the same ones I use in my book Leading in the Age of Data and our Data Literacy for Leaders course: Purpose, Ethics, Data, Technology, People, Process, and Culture.
The Data Literacy Score asks how well your team works with data as information. A statement from the Data factor, for example: "I can easily find and use clean, well-organized data when I need it to do my job."
The AI Literacy Score applies the same seven factors to how your team uses AI, from whether it's pointed at the right work to whether people use it responsibly. From the People factor: "My teammates can tell when an AI output is wrong, incomplete, or made up."
Each one also has an optional 15-question knowledge check. The rating statements tell you how people see the team, and the knowledge check tells you what they actually know. It's worth paying attention when those two don't line up.
What past teams have shown us
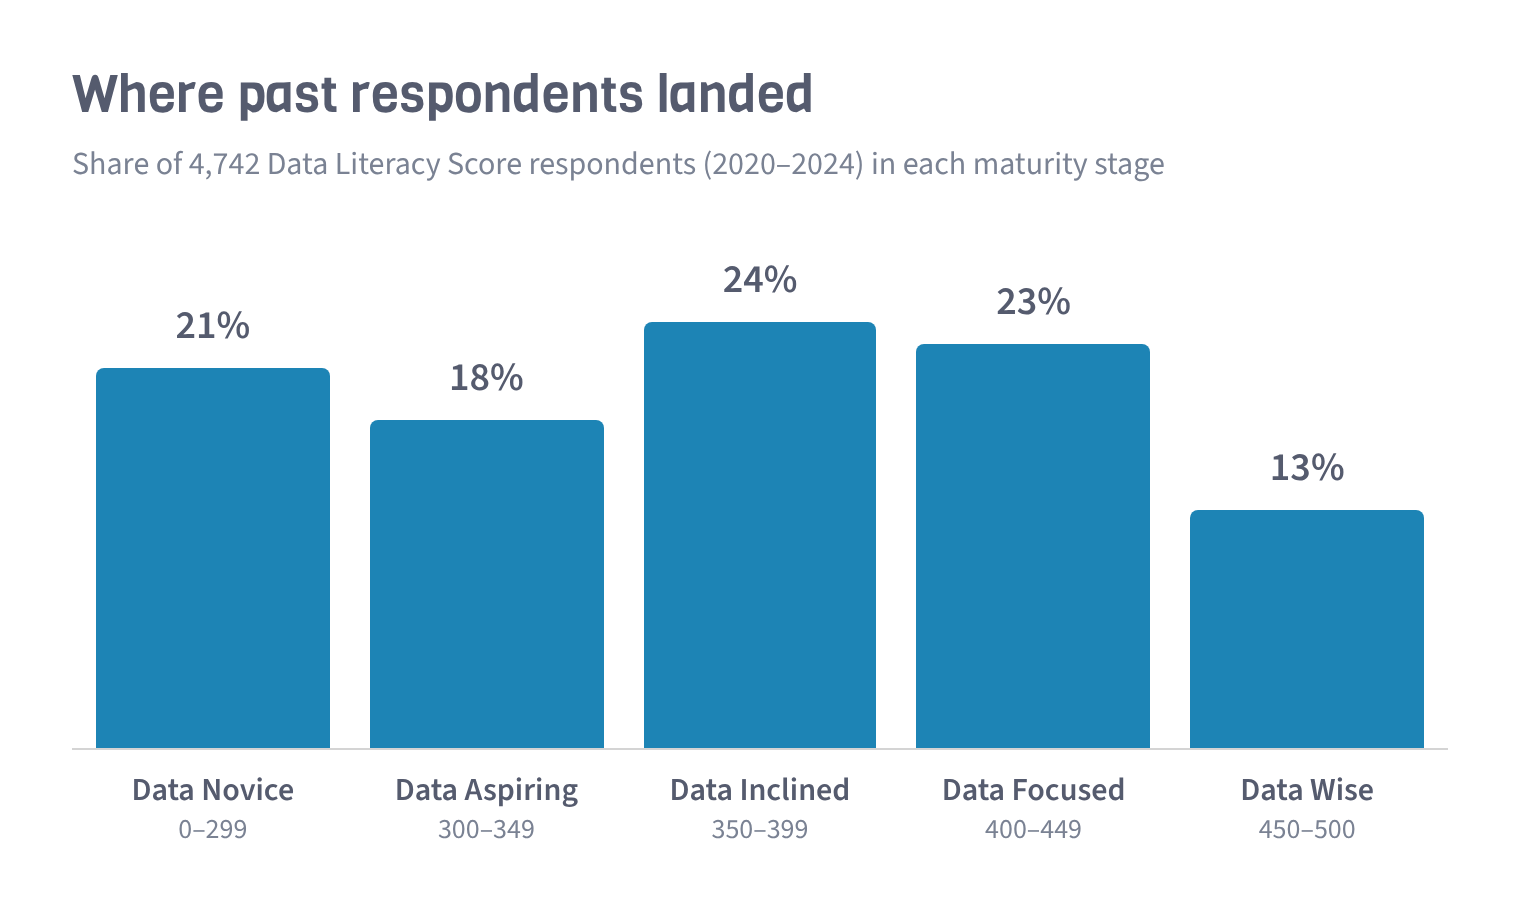
Of the nearly 4,800 people who've taken the Data Literacy Score, the median score was 371 out of 500. That puts the typical respondent in the middle of our five maturity stages, "Data Inclined." Team averages ran from about 300 to just over 400, so the spread between organizations is wide.
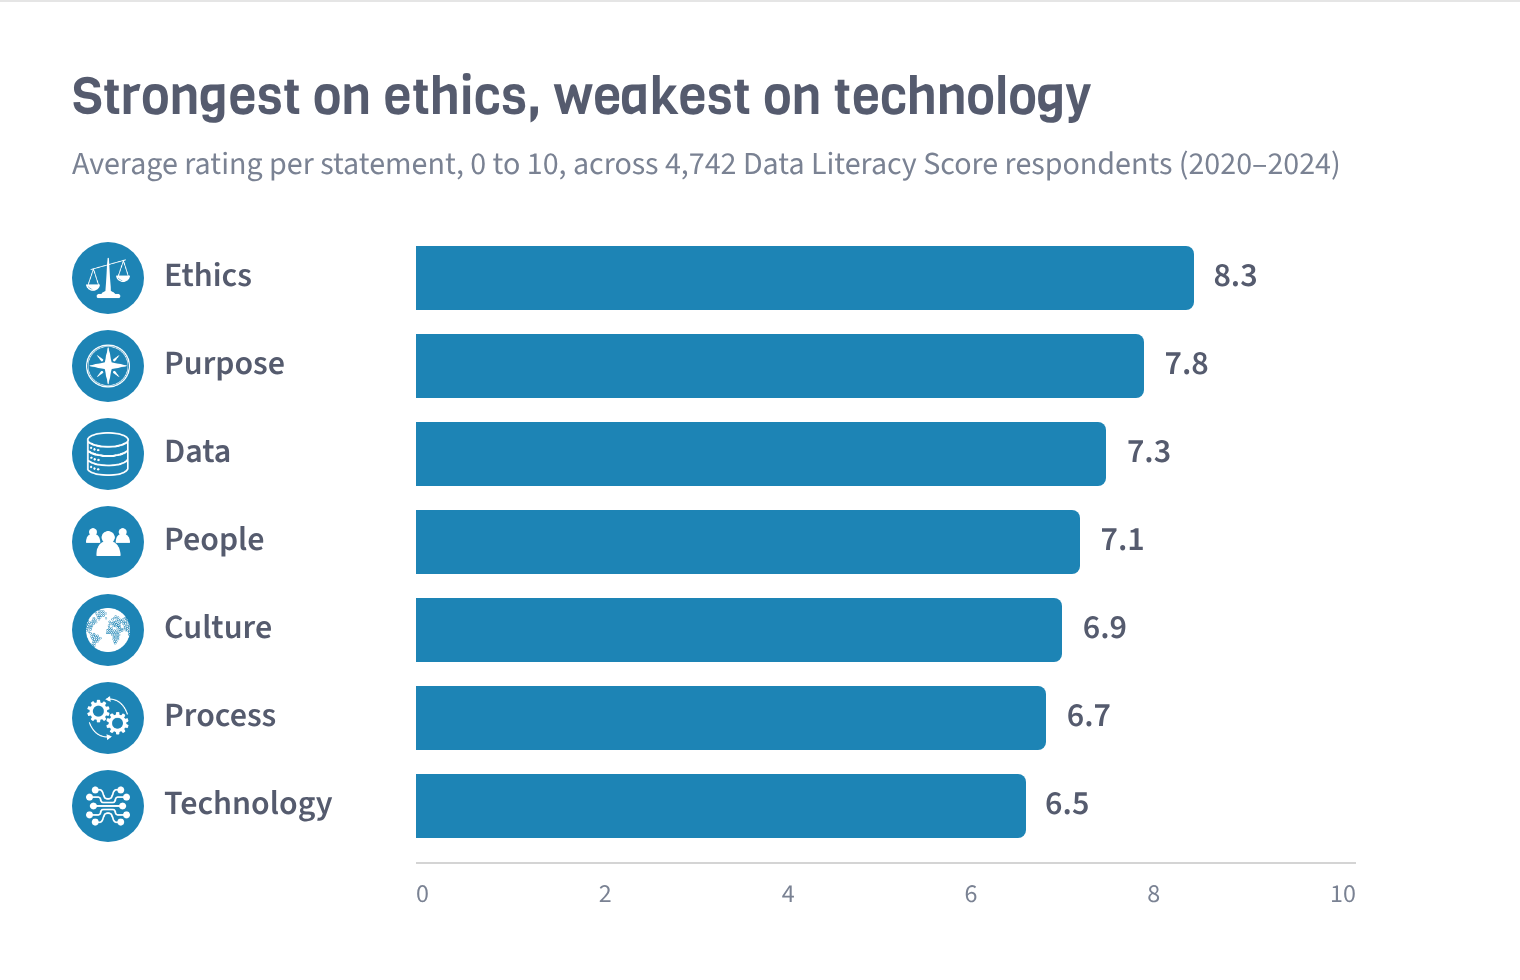
Across those teams, Ethics scored highest of the seven factors on average, and Technology and Process scored lowest. People tend to believe their organization handles data responsibly. They're less convinced it has the tools and processes to use data well day to day.
Your report puts your team's results next to those past respondents, as a percentile and as a rank among past teams. No past organization is ever named. They only appear as anonymous comparisons.
The AI Literacy Score is new, so there's no history to compare against yet. Early reports compare your team with itself: one factor against another, one group against another, and before training against after. A benchmark will follow as more teams take it.
How it works
- Buy it and set it up. Pick a size, create an account if you don't have one, and pay by card. Then name it, choose the optional sections, and add up to five questions about team, role, region, or tenure so the report can break the results down.
- Share one link. Everyone uses the same link. There's no sign-in, and we give you an invitation you can paste into an email or a chat channel.
- Watch it fill up. Your account page shows the response count while it's open. It takes about 10 minutes to answer, or about 20 with every section switched on, and it works on a phone.
- Read the report. When it closes, your leadership report is ready on the same page. Save it as a PDF to share with leadership, or download the numbers as a CSV.
Responses are anonymous, and the report is built that way too. It shows group results only, and any group smaller than five people is combined with others or left out, so nobody's answers can be picked out.
Pricing
One price covers the whole team, based on how many people take it:
- Up to 25 people: $1,000
- 26 to 100 people: $2,000
- 101 to 500 people: $4,000
- 501 to 1,000 people: $7,500
For more than 1,000 people, or if you'd rather pay by invoice, request a quote and we'll reply within one or two business days.
You can also add an expert review at checkout. Our team and I will read your results and write recommendations into your report, so leadership gets next steps along with the numbers. It starts at $3,000 and scales with team size. Reports with expert review are usually ready within a week of closing.
Run it twice
The most useful way to use either assessment is as a before and after. Run it as a baseline, train your team, then run it again. The follow-up report shows what changed, overall and factor by factor.
If you're working out what your organization needs to do under Article 4 of the EU AI Act, the AI Literacy Score gives you a starting measurement and a way to show progress. It's one part of the picture, not legal advice.
See for yourself
Each assessment page has an example report built from made-up responses, so you can see exactly what you'd get before you buy:
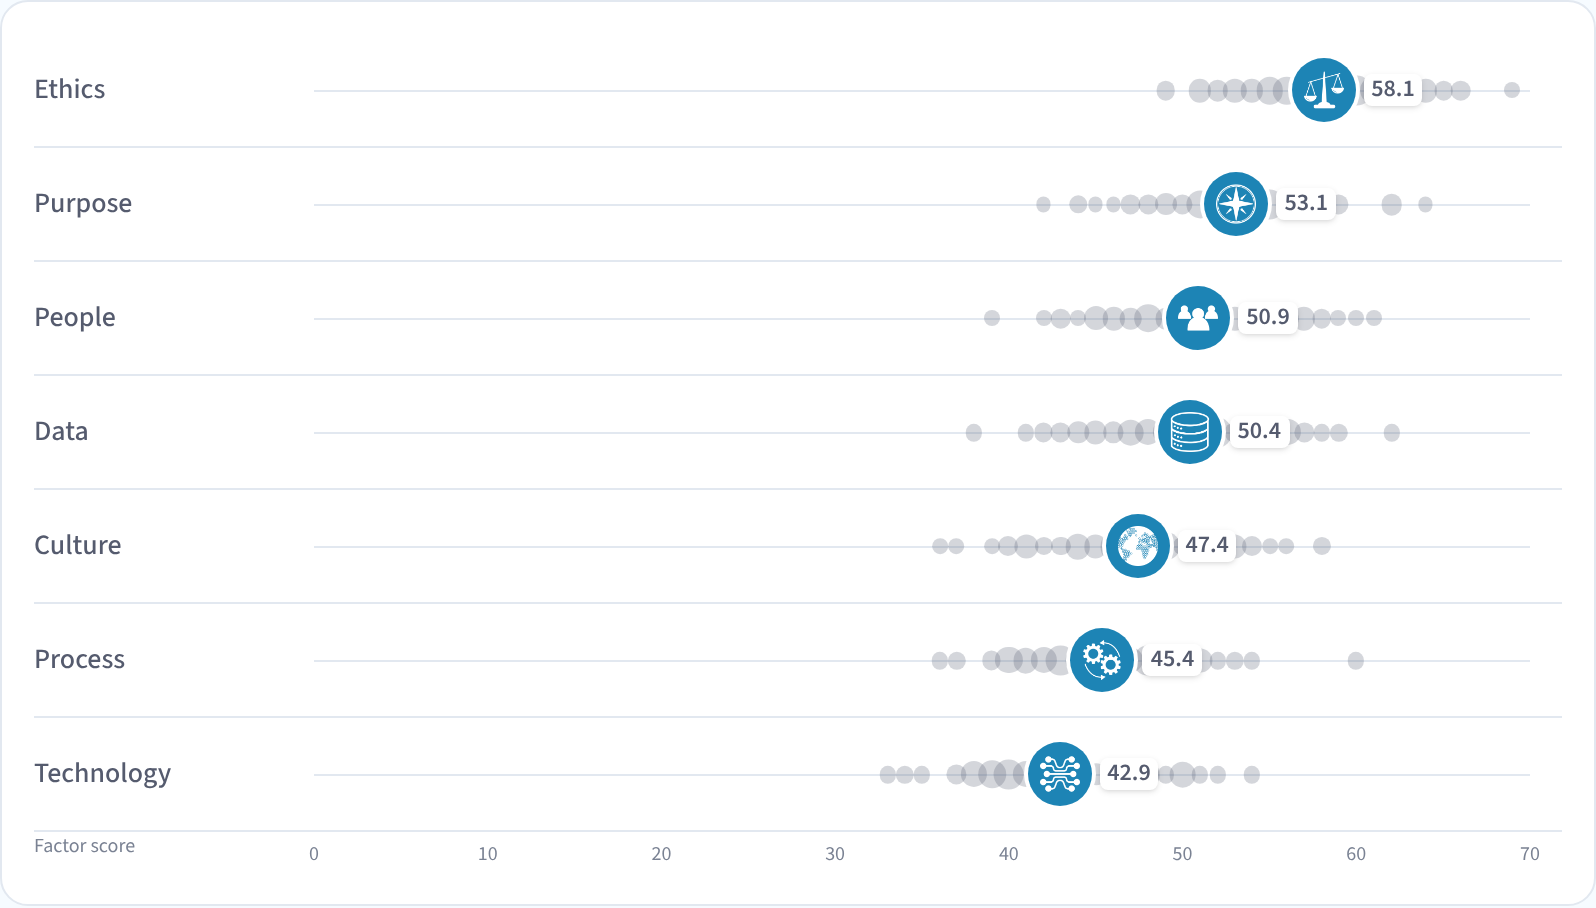
From the example report: the team's average on each factor, marked by its icon, with every respondent shown as a dot. Illustrative data, not a real organization.
If you have questions, or you'd like to talk through which one fits your team, get in touch. I'd like to hear how your team scores.
Enjoyed this post?
Get new posts and practical ideas for working with data and AI in your inbox.
Training your team on this?
Live workshops led by Ben Jones and on-demand courses with an AI Coach, for teams of 10 or more.
See team training optionsKeep learning
Explore the full library of data and AI literacy courses, with an AI Coach to guide you.
Browse courses