Our Data Storytelling for IMPACT Course is Finally Here!

By Alli Torban, Senior Data Literacy Advocate at Data Literacy
For years, I’ve seen people do incredible analysis, but then hit a wall when trying to communicate it. They’d end up hand-waving in front of their dashboard or cramming way too much on a slide.
I’ve been there too, and it’s devastating to have your hard work overlooked because you weren’t good at communicating it. And that’s exactly why I created Data Storytelling for IMPACT.
This course is the product of everything I’ve learned in my career. I’ve been the data analyst, the data visualization specialist, and also the data trainer, teaching hundreds of people these concepts. And now I’m bringing it all together in an informative course that’s also practical, fun, and actually doable in the real world.
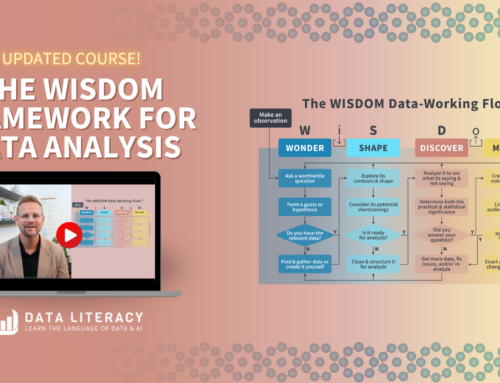
The structure of the course is built around something I’m obsessed with: working in iterations. Instead of waiting until the end to test if your story works, you test throughout the process, just like Agile software development (my team used this on my very first job out of college, and I’ve loved it ever since). That way, you’re always improving your message and visuals as you go, and you’re far less likely to hear “I don’t get it” in the final meeting. Each of the six steps in the IMPACT Framework (Insight, Message, Plan, Align, Clarify, and Test) gives you a repeatable rhythm to follow. I genuinely use it in my own client work, and I hope it becomes a go-to tool for you, too.

There are three ways that you can take it: as a corporate team (live or on-demand), as an individual by enrolling online, or via our new brand All-Access subscription offering, which gives you access to the rest of our growing library of data and AI courses.
My absolute favorite part of the course? The comic.
As you move through each lesson, you’ll follow Becky and Fern (her faithful desk plant🪴) as they create a real data story using the IMPACT framework. It’s based on an actual internal project I did for the Data Literacy team. I wanted to show (not just tell) what good storytelling looks like, so I turned it into a visual story you can watch unfold. It’s lighthearted and totally relatable. Here’s a time-lapse of me drawing every comic frame in the course in under 30 seconds:
I packed this course with all my hard-earned expertise, and then wrapped it up in a no-fluff package that’s easy to get through in under 90 minutes. You’ll also get a downloadable workbook to guide you step-by-step through your own data story, plus knowledge checks and a badge to show off your new skills.
So, if you’ve ever struggled to get your audience to care about your data, or if you want a clear, repeatable method for making your insights land, then I made this just for you. I hope this course empowers you to feel more confident, creative, and in control of your message.
And if you decide to take the leap, I’ll be cheering you on every step of the way. 🤗
—Alli