About.
INSPIRED BY DATA.
Ben Jones is the founder and CEO of Data Literacy, LLC, a training and education company that’s on a mission to help people learn the language of data. Ben is a highly experienced and passionate instructor, having taught data to thousands in a corporate training environment as well as in academic classroom settings (University of Washington). He is also a published author (Avoiding Data Pitfalls, Wiley 2019 and Communicating Data With Tableau, O’Reilly, 2014), a talented public speaker, and a recognized thought-leader in the data world. To balance out the digital side of life, Ben enjoys hiking and backpacking with his family in the mountains of the Pacific Northwest.

Experience.
AWARD-WINNING.
Ben is Founder and CEO of Data Literacy, LLC, a company on a mission to help people speak the language of data. Prior to launching his company in December 2018, Ben spent 6 years at Tableau Software in Seattle, Washington, where he led the global marketing effort for the award-winning Tableau Public platform. Over that time, Tableau Public grew 20X in monthly active users, and was routinely named as one of the top data visualization platforms in the world.
Ben is also an award-winning data visualization designer, having won first place in the 2012 Tableau Iron Viz Sports Contest as well as Crowd Favorite in the 2012 Iron Viz Biz Viz Contest.
01. RECOGNITION.
From 2014 to 2018, Ben co-chaired the Tapestry Data Storytelling conference, a conference that was named one of the “7 Must-Attend Visualization Conferences of 2014”. This event brings together academics, practitioners, journalists, designers and tool builders who are all interested in how to change hearts and minds with data.
Ben is also an award winning continuous improvement project leader and mentor, winning the 2007 Medtronic Star of Excellence for a Lean Sigma project in which he and his team improved a medical device refurbishment operation. After winning the 2007 award as a project leader, he went on to train and mentor teams that won the same award in 2009 and 2010.
02. EDUCATION.
Ben holds a Bachelor of Science degree in Mechanical Engineering from UCLA (2000) and an MBA with a specialization in Entrepreneurship from California Lutheran University (2011). Ben also completed a Supply Chain Executive Leadership program at Penn State University (2010).
Ben was the valedictorian of the 1996 graduating class of Thousand Oaks High School, where he graduated first in his class of 550 people.
WORK.
PUBLISHED.
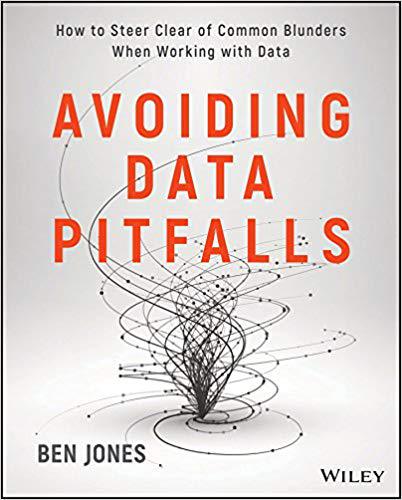
Avoiding Data Pitfalls is a reputation-saving handbook for those who work with data, designed to help you avoid the all-too-common blunders that occur in data analysis, visualization, and presentation.
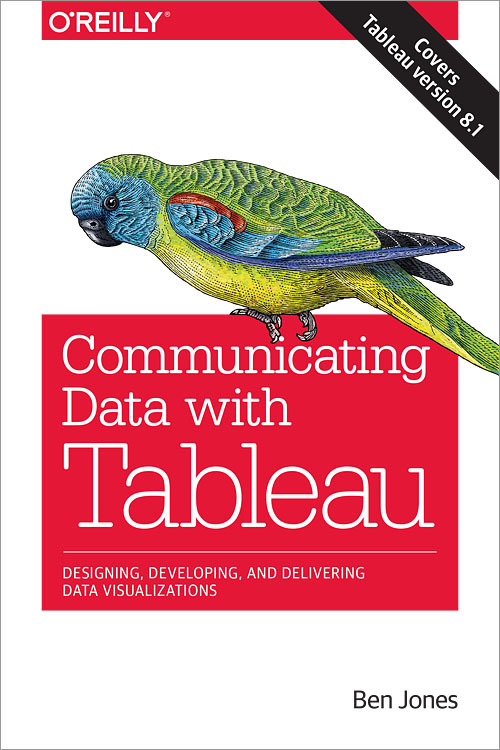
Communicating Data with Tableau – Go beyond spreadsheets and tables and design a data presentation that really makes an impact. This practical guide shows you how to use Tableau Software to convert raw data into compelling data visualizations that provide insight or allow viewers to explore the data for themselves.
Ben published the 17 Key Traits of Data Literacy: Organizations are waking up to the reality that in order to become more data-driven, they need to attract and develop highly data literate team members. But what does it mean to be highly data literate? Find out the types of knowledge and skills that these sought-after contributors possess, as well as the attitudes and behaviors that they demonstrate on a regular basis.


