Episode 04: Create Better Data Stories by Testing Early and Often
Listen on Spotify, Apple Podcasts, YouTube, or wherever you get your podcasts!
In this episode of The Data Literacy Show, hosts Ben Jones (CEO of Data Literacy) and Alli Torban (Senior Data Literacy Advocate) introduce a smarter, iterative way to build data stories. They share how using small tests at every step of the process—based on the IMPACT framework—can save you time, reduce frustration, and dramatically increase your chances of success.
Topics covered:
-
Why data storytelling should be iterative, not linear
-
An overview of the IMPACT framework: Insight, Message, Plan, Align, Clarify, Test
-
Lightweight testing techniques you can use after each step
Resources mentioned:
Subscribe now to never miss an episode, and let’s make data accessible for everyone!
We’re planning on launching a new data storytelling course in early June 2025. We’ll walk you through the IMPACT framework with examples, comics, quizzes, and lots of passion for data storytelling. 🙂
______________
TRANSCRIPT:
Alli Torban: [00:00:00] Welcome to the Data Literacy Show, the podcast that helps organizations build, measure, and level up their data and AI literacy.
Ben Jones: I’m Ben Jones, co-founder and CEO of data literacy, where we help people learn the language of data and AI through tailored training and assessments.
Alli Torban: Yes. And I am Alli Torban, the Senior Data Literacy Advocate here at Data Literacy.
Alli Torban: On today’s show, we’re talking about how you can make better data stories by turning it into an iterative process. We’re gonna share our impact framework and how to incorporate testing into each part of the process.
Ben Jones: Alright, exciting. So if you have ever built a data story that didn’t quite land. Or if you’ve waited until the very end to get feedback, only to realize your message missed the mark, then this episode’s for you.
Alli Torban: Mm-hmm. Right. That I am definitely guilty of that
Ben Jones: same
Alli Torban: um, or if you need to create a data story [00:01:00] and you don’t even know where to start. Mm-hmm. The impact framework is actually gonna be really great. Help for you too, because it maps out every step. And the big thing with the impact framework is that you are creating a data story in a process that’s not linear.
Alli Torban: So whenever I have created a data story, my process is very cyclical and iterative. So the impact framework is based on that. And I am also constantly testing and going back and refining what I’ve already worked on.
Ben Jones: This whole framework you developed, Ali, it’s really kind of inspired by Agile software development, right?
Ben Jones: Tell us a bit about that.
Alli Torban: Right? Yeah, so in my early career I was a software tester and we used a an agile process and really all it is i’ll. Very high level is you’re not waiting until the end of the software development lifecycle to get feedback. You test as you go and you’re constantly improving, talking to the client, getting feedback, and we’ll link, uh, in the show notes a link about Agile if you’re interested in more details about that [00:02:00] process.
Alli Torban: But the impact framework took inspiration from that because it’s iterative and we’re doing small tests at every step.
Ben Jones: Yeah, and I can definitely see why, you know, that totally applies to data storytelling or creating one. I mean, I’m thinking back to my own career and I’ve been in, you know, the situation from time to time where, you know, I put a ton of time into working on some presentation.
Ben Jones: Then I realized maybe after the fact that what I’ve presented isn’t quite what my audience wanted or needed. Mm-hmm. Or it was maybe missing some major points that I really could have or should have made. And I could have even caught that point earlier, maybe if I had, you know, tested it little by little along the way.
Alli Torban: I know it’s so smart to be constantly checking, making sure you’re right on the right path, right? Like you do a lot of hiking, you’re constantly checking, am I still on the path? I haven’t wandered out, right? Sometimes a little
Ben Jones: too much checking, but yeah,
Alli Torban: yeah, you can save time and you dramatically increase your chances of creating a successful [00:03:00] data story when you are constantly testing along the way.
Alli Torban: And by success I mean, did the data story achieve what you wanted it to achieve? So it’s important to talk about that upfront. You either want your audience. To make a decision, maybe they’re taking an action or maybe just to fully understand a situation.
Ben Jones: Yeah, you really do have to to find that, you know, upfront right away, because then that really is going to inform each little step of this impact framework you’ve put together for us.
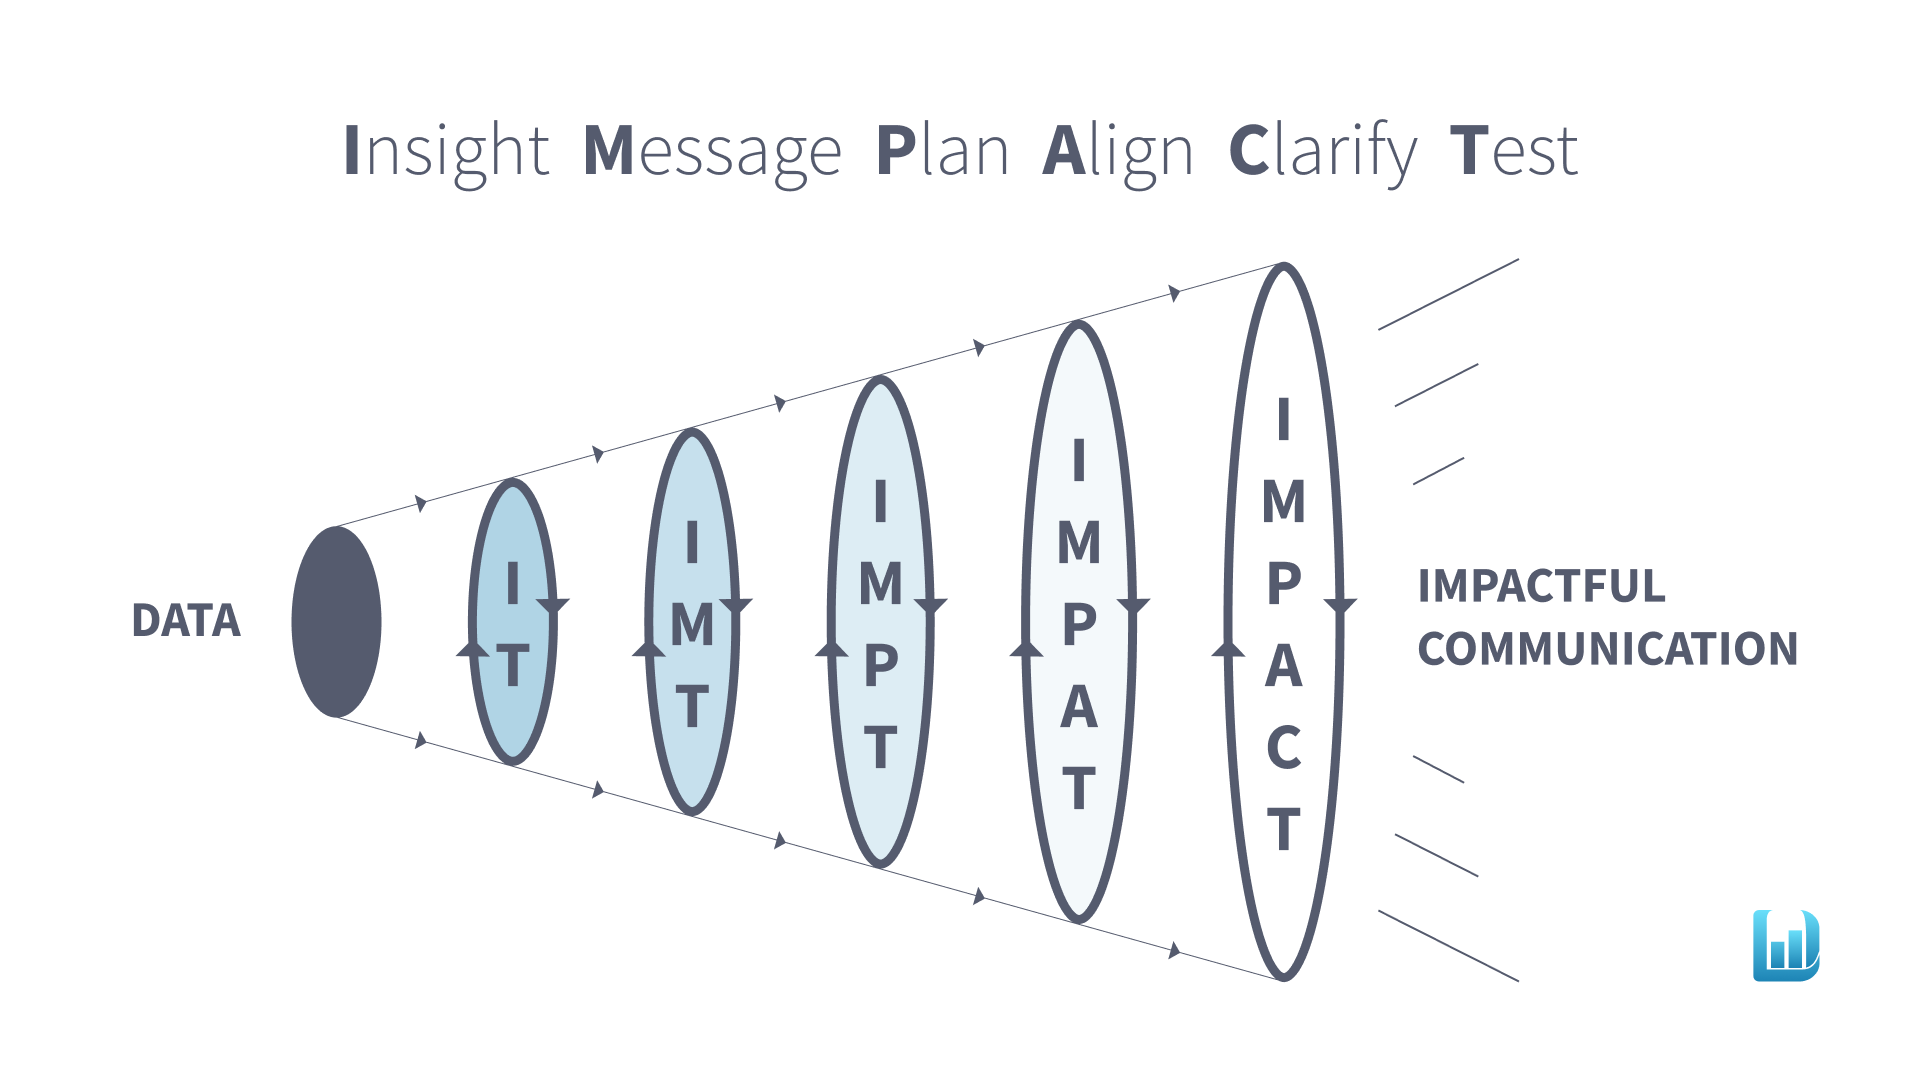
Ben Jones: Mm-hmm. So, you know, let’s talk about that. This impact framework, well, AIM impact is an acronym and there are phases impact. We start with insight, then we go to message, plan, align, clarify, and test. I-M-P-A-C-T.
Alli Torban: Mm-hmm. And it does sound linear when you say it like that. ’cause you know, you do have to list it out.
Alli Torban: But we’ve set it up where you actually complete one phase and then test.
Ben Jones: That’s the T, right? So the T comes in. Ah-huh. [00:04:00] Mm-hmm.
Alli Torban: So you, first time you, uh. Find your insight and then you test. Test the insight. Just
Ben Jones: the insight.
Alli Torban: Yeah, just the insight. Mm-hmm. And then you go to the next step insight message test.
Alli Torban: Mm-hmm. And then each time you’re adding a step testing, and also during that iteration, you’re revisiting the previous steps because it’s likely you’re gonna need to make edits on something you did previously based on the feedback you got during testing.
Ben Jones: Sort of like mini tests, micro adjustments.
Alli Torban: Mm-hmm.
Ben Jones: Sometimes big adjustments based on, I guess the kind of feedback. Maybe you find out you need to start all over, but with each of these little tests you do, you know, you can make that adjustments. You can make that adjustment early so that you’re not going get so far down the road and waste effort you’re going to.
Ben Jones: Basically increase your chances of crafting a relevant data story, you know, of really hitting it outta the park. So let’s talk a little bit more about, you know, what’s involved with maybe each step. And then, you know, Ali, you can give us a, a suggestion on how you would test at [00:05:00] that specific phase.
Alli Torban: Yeah, that sounds great.
Alli Torban: Let’s go.
Ben Jones: Okay, cool. So let’s do it. So first we have insight. So this is all about identifying, you know, what data sets are you working with, what metrics are involved, maybe what charts sort of. Are already available and exist, and from that you brainstorm the insight that you’ve gleaned. This is sort of what is the nugget or the aha that you’re trying to capture and convey,
Alli Torban: right?
Alli Torban: Yeah. It’s really important to get organized and prioritize all your data at the beginning, and maybe you, I. Enter this already knowing your insight, but sometimes you do need to organize all the data. You have all the charts. Where are you starting out? We don’t wanna just throw a ton of data at our audience just because we have it, right?
Alli Torban: That’s not good data communication. Uh, so when you do have an insider too, that’s worth sharing. In order to test it, I would find some sort of colleague, maybe a stakeholder, someone who, uh, might be in your audience later for the data story or even a subject matter expert about your chosen insight. And there are a few questions [00:06:00] I am looking to ask them.
Alli Torban: What context might I be missing with this insight I tell you, could there be any other explanations? Is this insight clear? Do you think it would lead to whatever decision or action that I’m hoping for? And then you can use whatever feedback that they have to maybe go back and and get another data set.
Alli Torban: Or maybe you’re fine with the insight you have, but a lot of times people look at things from a different angle and they’ll bring their expertise and ask you a question that maybe you didn’t consider, and you might need to tweak your insight a bit.
Ben Jones: Yeah. So it’s almost like you’re testing that. So what upfront.
Ben Jones: So here’s your your key insight and the person really is able to say, well, you know, do I think that matters? Do I think that’s important? Mm-hmm. Is that something that is notable and important? So then, yeah. Or
Alli Torban: did you consider this
Ben Jones: uhhuh? Maybe there’s another way to think about it, or some information you don’t know that would make that insight.
Ben Jones: Maybe less. Impactful.
Alli Torban: Right. Um,
Ben Jones: so you can go back and tweak it. Okay. So that gets us through [00:07:00] INT Insight test. Okay? Next step, next cycle, we add in the message. So that’s m this is where we’re gonna create a real succinct message, right? And we want that message to be super dialed in and relevant to the audience specifically that we’re gonna speak to.
Ben Jones: So first we have to think about, you know. Well, who is that audience? Mm-hmm. Think about the, the main audience or the, what we call the primary audience. Maybe there are secondary audience members, and even sometimes you might define a third phase or tertiary kinda level of audience members. Um, and then what we want to do from there is brainstorm and research who they are.
Ben Jones: Mm-hmm. What are their goals? What are they frustrated about?
Alli Torban: Right, exactly. If you don’t know what’s relevant to the people you’re speaking to, then how can you create a relevant message for them, right? Mm-hmm. Exactly. So you can use that research to create some sort of message, a succinct, relevant message for your, uh, [00:08:00] audience.
Alli Torban: And what I like to do is just put it in a very simple formula to start, because as you know, it’s very hard to just start, get something down first. So I use a very simple formula, which is your insight, so you state your insight. Plus then you add any helpful context to your primary audience, and then if you have a recommendation, you add that.
Alli Torban: So just start with that simple format. It’s a good starting point where you can start testing your message to make sure it’s relevant. To your primary audience. So to test it, I would take that message and ideally share it with someone in my primary audience. But as we know, that’s not always possible. So think about whether you can find someone in your secondary or tertiary audience, or someone who knows your primary audience really well.
Alli Torban: That’s also a good option. Mm-hmm. And the few things I’m asking are, is this, is this message relevant to you or do you think it’s relevant to the, whoever’s in my primary audience.
Ben Jones: Mm-hmm.
Alli Torban: Is anything unclear or missing? Would a presentation [00:09:00] about this help you make whatever desired decision or action.
Alli Torban: And these open-ended questions are gonna help them, um, help you uncover whether this message is relevant and actionable or worthy of a decision like you hope it is.
Ben Jones: Right? So they’re gonna give you some feedback about all of this at this point. Mm-hmm. And then, so you can maybe not just revisit the message, but it’s important to.
Ben Jones: Note that maybe you actually have to revisit the insight as well, right? So you get a chance to go back and touch on both of those again and make sure you clear that gate and that you’re feeling good about it, right? Mm-hmm. So now we’ve got through i, m and T. Mm-hmm. We want to add the next one, P for plan.
Ben Jones: So plan, what are we planning? We’re planning. The narrative arc, the storyboard, the flow of the data story. Step one, step two, message 1.1, 0.2, how is this message going to build or unfold? And so this could involve sketching, this could ev evolve slides, you know, maybe whatever kinda your tool of choice is there, right Ali, to kind of pull out the storyline.
Alli Torban: [00:10:00] Right, and I think this is a good point to bring up also the definition of a data story because mm-hmm. A lot of times you think, maybe I’ll screenshot my dashboard and that’s a data story, but we define a data story as a sequence of graphics that forms a cohesive narrative. So if you’re are going to have some sort of narrative, you’re walking someone through your data, it’s going to be through a series of steps, right?
Alli Torban: So. This is really tough because you can present information in so many different ways. There’s no one right answer, but they can always
Ben Jones: reorder it. Yeah, you can always come up with a different sequence,
Alli Torban: an infinite amount of sequences. Right. But I recommend sequencing through your information in a way that your primary.
Alli Torban: Audience. Mm-hmm. Likes to be communicated with. That’s our main goal. Not necessarily how I like to be communicated with, but how my primary audience likes to be communicated with. Well, help me
Ben Jones: break that down though, Allie. Are there certain kinds of audiences, like how would I really kind of figure that part of it out?
Alli Torban: Yeah. I, into my experience, I have found that there’s. Three different ways people tend to like to be [00:11:00] communicated with. Mm-hmm. So some people like to be communicated with in more of an executive style, so maybe they want their recommendation right up front. Right. Just hit me
Ben Jones: with it.
Alli Torban: Yes. Just give me, gimme what you’re talking about.
Alli Torban: That’s in the chase. Busy.
Ben Jones: Mm-hmm. Yeah.
Alli Torban: Um, and some people have more of an analyst communication style. They want you to start from the beginning, share all the details from start to finish. Maybe I want the data set at the end too.
Ben Jones: That’s probably more me, but anyway. Yeah. Yeah.
Alli Torban: Yeah, I agree. Kind of
Ben Jones: more getting into the nitty gritty.
Ben Jones: Mm-hmm. Not necessarily lost in the weeds, but I like to see the richness of what, find these Yeah. I don’t wanna see the
Alli Torban: details. Yep. Mm-hmm. Yep. I know that about you. That’s number two.
Ben Jones: Okay. Executive. Yes. And, and less, what’s, what’s the third?
Alli Torban: The, the third one is more of an advocate communication style, where sometimes they wanna see more case studies and testimonials, more like the human side.
Alli Torban: How is this affecting our community? And we are obviously a mix. Of all three of these, but usually you will find in yourself and other people, there’s one or two that are a bit stronger. Mm-hmm. So in the course, actually, we have a data Storytelling on demand course that’s coming [00:12:00] up very, very soon. We recommend a couple of narrative sequences to start with for each of those communication styles so that you have the ability to just get started with a, uh, sequencing, sequencing through these, um, through your data story, depending on your preferences of your primary audience.
Alli Torban: But it’s really important to know that. You can mix and match these different narrative sequences and you also have to test it. You might think that it is going to work out a particular way, but once you’re tested on someone, they’ll help you figure out the things that aren’t really hitting. So once you’ve sketched out sequencing your data story, like I’m gonna.
Alli Torban: Talk about this point, this point, then this point. Um, you can ask someone in your primary audience, ideally, or maybe someone in your secondary or tertiary audience to look at how you’ve sketched out and storyboarded how you’re going to, um, show the flow of your data story and ask a couple questions. [00:13:00] I show it to him and I ask, was there a point where you did not feel engaged or maybe you felt confused or maybe you felt particularly engaged or interested in that particular part?
Alli Torban: And also ask, does anything feel out of order or even unnecessary to you? And that will help determine maybe I need to. Like you said, put the recommendation up front or maybe this part, they thought, why is this any even in here? This is so unnecessary or not relevant to me, and it’ll help you tone down.
Alli Torban: Or maybe you need to flesh out a particular part of a data story a little more.
Ben Jones: Okay. So they might say something like, you lost me at the this point. Mm-hmm. Or, I didn’t see the jump from this thing you said to that thing you’re gonna say. Right. Um, or maybe they’re saying, well, there’s a missing piece of the puzzle that you’ve shown me.
Ben Jones: You’re really not considering. Including a certain angle that if you added that, it would really put the exclamation mark on and if you also incorporated that at the end. Right.
Alli Torban: Yeah. Wouldn’t it be nice to know that before the final, or you’ve spent [00:14:00] all these time making all these charts?
Ben Jones: Yeah. You left a piece of the puzzle out on the table.
Ben Jones: Yeah. Okay, so all this feedback, what is this gonna do? It actually might bring you back to that insight again. Yeah. It might, you know, and it might even. Lead you to find more data. Maybe there’s that missing link. Mm-hmm. Maybe your sequence is, um, has a hole in it, right? Yeah. Uh, so that’s IMPT, but we have two more to go.
Ben Jones: So let’s add the A for align. So I think from what you’ve described to me, Ali, uh, you know, this can come, can be a fun part where you get to, you know, especially for those of us who are super visual Yeah. Where we try to align the chart type or the visual with. Each part of the message mm-hmm. To really make sure we’re aligned on their visuals that they’re perfectly connecting to and lined up with that, that narrative we’ve created.
Ben Jones: And you know, now you might have to use charts that are already made, made, or maybe you have to make your own, but you really are kind of thinking carefully about. The chart type that is necessary for your presentation. [00:15:00]
Alli Torban: Right, exactly. And this is such a common misconnect misconception. I remember when I learned this, where you have your exploratory charts that you use during your exploration, and maybe when you found your insight.
Alli Torban: Mm-hmm. But you also need to make your explanatory charts to explain your insights. Sometimes they’re the same chart, but sometimes they’re not. And that’s okay. And that’s normal and it makes sense. So we actually like to use the Financial Times Visual Vocabulary Resources, which I’ll link in the show notes.
Alli Torban: It’s, it’s really cool. Yeah, we love it. We use it all the time. I have it printed out because it shows a ton of different chart types that you can use. Based on the data relationship that you’re trying to highlight. So like there’s a bunch of chart types that show magnitude really well or part to whole or change over time.
Alli Torban: So it’s gonna help you pick a chart type that highlights the message that you are really trying to convey at that particular time in your story. Once you have created your charts, share them with someone again in your [00:16:00] primary audience if possible, or secondary, tertiary. And one trick that I like to do is I actually take the title out of my chart and then I ask someone.
Alli Torban: What do you think the title of this chart should be? Because
Ben Jones: yeah, it
Alli Torban: immediately unveils what part was obvious to them or what relationship I they thought I was trying to highlight. And sometimes it’s exactly what I was hoping for. And sometimes it’s like, oh, maybe I need to rethink the colors or the chart type or something, because what I was trying to convey was completely lost on them.
Ben Jones: And it’s very revealing because yeah, maybe their eyes are going somewhere totally different. Who knows? Mm-hmm. And you need to kind of direct it a bit. So that can be a very revealing answer. You know what’s popping out to them, and then maybe you think they’ll see one thing, Hey, who knows? Maybe they don’t.
Ben Jones: Yeah. Okay, so this last. Step, uh, clarify. C Now this is sort of where we get in and we fine tune and we get all the things, uh, that are part of the story to be just kind of closer to [00:17:00] perfect, right? Mm-hmm. So it’s a refinement. We’re looking at design of charts. We’re looking at. Maybe not even just the graphics or the annotations or the fonts or colors.
Ben Jones: We’re even thinking also about ourselves and how we’re going to present. So, you know, maybe you’re going to be live in the same room with them, maybe you’re gonna be on Zoom, maybe you’re presenting, uh, perhaps in, maybe in a report that gets, uh, submitted. So you’re not gonna talk to them. But if you are, this is where we actually think about the delivery itself as well.
Ben Jones: Mm-hmm. So your tone. The loudness of your voice, maybe. Um, what are the ways you’re going to really get the message across to this audience? And this is the last mile, but it’s make or break, right?
Alli Torban: Mm-hmm. Yeah. It’s, it’s the worst when you have spent so much time. I. On a data story, and then you’re presenting it to someone and maybe you’re speaking in a very quiet and monotone voice and they just completely, you know, pick up their phone and start texting or something.
Alli Torban: Yeah. You’re like, wow. And they tune right out. [00:18:00] Exactly. Yeah. What a bunch of what such a waste of time. Mm-hmm. And so we do not want that to happen. Mm-hmm. So in the course, we talk a lot about, um, some design tips, what I call the 80 20 of design, like the, I don’t have a design background, but. The design tips that I have learned that you get a lot of mileage out of just some small tweaks.
Alli Torban: So when you’re designing your chart and also your slides or maybe your report, uh, you, everything can be looking really clear and impactful for you, for your audience. But. Also thinking about, like you said, thinking about yourself, how you’re presenting. If you are presenting in person or on Zoom, you want it to, you want to do your data story justice.
Alli Torban: So we have found that the way you speak is very important and it’s something that you can practice and get better at. Because I was a terrible public speaker, but through lots and lots of practice, I have gotten a lot better. Yeah. And this is a learnable skill. You’re not born with it. [00:19:00] It’s, I mean, maybe you’re born with a little tendency, a little bit of talent, but you can learn this skill.
Alli Torban: Yeah, you can. So I definitely recommend practicing and getting feedback the way that you deliver your data story. Mm-hmm. Because you want it to be crystal clear for your audience. You don’t want them to be distracted by the way you speak. So. To test this, ask someone who will give you honest feedback. It doesn’t need to be someone necessarily in your primary audience, but just someone who’s gonna give you honest feedback to watch your presentation.
Alli Torban: And what I like to do is have them rate from one to five how well you varied these four vocal levers that you can pull, so you can change your pace, how fast or slow you spoke your volume, how quiet or loud you are, your pitch, how high or low your voice was, or how often you pause. Sometimes you wanna pause for effect.
Alli Torban: Mm-hmm. And sometimes, you know, you wanna speak a little bit faster and have fewer pauses, but these are just four levers that you can pull to make your speaking style to be varied, [00:20:00] and it keeps people’s attention really, really well.
Ben Jones: Yeah. And I, I think you’re right. I mean, I’m terrible at this, but it is so great to run through the presentation from beginning to end, you know, maybe more than once maybe.
Alli Torban: Yeah.
Ben Jones: Um, and then actually not just doing it for the sake of doing it, but then also again, here’s that test piece of it. Getting feedback,
Alli Torban: yes.
Ben Jones: In the dry runs, but not just that. Getting feedback after. Showtime. Yeah. The actual presentation, you deliver it, you’re done. Now you have another opportunity to test by saying, well, how did that go?
Ben Jones: So you can learn a lot. That’ll really help you incorporate feedback for your next data story. Um, and that’s really I think where you will start to see continuous improvement if you kind of have the courage to, um, ask the question, you know, and have kind of a. Inner sense of security that even if someone has some constructive feedback or even if what they say stings, then that just means you’re gonna be able to kind of get stronger and, and [00:21:00] move forward.
Alli Torban: Yeah. Yeah. So that is the impact framework at Love It a very high level. Cool how you’re iterating, you’re testing and it matters because this mm-hmm process is gonna save you time and it’s really gonna help you avoid going down the wrong path before you even realize it and having to redo everything after the fact.
Alli Torban: And it’s that you don’t wanna be in that situation.
Ben Jones: Yeah, and because you know, you’re constantly checking for relevance throughout this cyclical process. So then well, when you get to the end, that final story. Yeah. That’s much more likely to influence your audience, have impact on them. You want to not just tell a great data story.
Ben Jones: Right. What do you wanna do? Drive a decision or an action? Kind of create some kind of mutual or shared understanding.
Alli Torban: Yeah. Yeah. And it actually builds trust too. Mm-hmm. Because your audience can sense. A story was crafted with them in mind and you weren’t just, you didn’t just paste in a bunch of charts from Excel last minute and like, or maybe screenshot your dashboard and you’re hand waving through it, like people can tell.
Alli Torban: Mm-hmm. That’s not been there. Not with [00:22:00] them in mind. Yeah.
Ben Jones: Okay. So. First of all, Allie, I love this model. You’ve created it. It is so cool. I love the concept of applying this agile approach to data storytelling. You know, you’re creating something, it’s the creative process. Mm-hmm. So, yeah, it’s a great way to do that.
Ben Jones: So let’s recap it, right? So number one, what you’re not thinking about doing here is building the whole thing all at once in some kind of a cave, and then emerging, right? Instead, make it iterative, continually adjust, and get feedback from people along the way. And then to do that, you can rely on this impact framework.
Ben Jones: Okay, so what does it stand for again? I for insight, M for message, P for plan, A for align, C for clarify. And T for test. And so after each step that t for test comes in, you do a quick test to validate, adjust, and then move on. Why is this good? Well, it’s gonna save you time. It’s going to reduce frustration, uh, at a [00:23:00] data story that doesn’t land.
Ben Jones: And ultimately it’s going to help the quality of the final product you’re gonna build. A better data story if you go about it this way.
Alli Torban: Mm-hmm. Yeah. And that’s really all we want was to spend time, spend our time really well on creating a quality data story. And if you wanna learn more about how to use the impact framework, we’re in the final stages of creating our on-demand course all about it right now.
Alli Torban: Our launch date is early June, 2025. So you can go to the show notes and add your name to the wait list. So you will be the. First to know when it’s live, and if you’re listening to this after June, 2025, you can go to the show, the show notes, and, uh, it will be live and waiting for you to, to enroll in it as well.
Ben Jones: Yep. And that’s great for individuals. Mm-hmm. Let’s say you work on a team or your group needs this kind of a training, well, we can set you up with that as well. Uh, Becky, uh, my co-founder, she will. Get you all dialed in so we can do this live virtual. We can even get on site and do an in-person workshop if you want.
Ben Jones: So reach out to Becky. You can get her at [email protected] and we’ll uh, we’ll, we’ll see what you need.
Alli Torban: Yeah. Thanks for listening to the Data Literacy Show. If you found this episode helpful, please share it with someone who is also trying to get better at communicating with data.
Ben Jones: And don’t forget to subscribe so you’re not gonna miss the next episode and you can find everything we mention today in the show notes.
Ben Jones: At data literacy.com.
Alli Torban: See you next time.
Ben Jones: Bye. All right. Bye everyone.

