Insights Revealed: 5 Common Data Pain Points Today’s Organizations Face
In what ways is your team creating an environment where data literacy can flourish, and on the other hand, what factors might be getting in the way of your team’s ability to reap the benefits of data literacy? The Data Literacy Score Team-Based Assessment can help answer those questions for you.
February marked the two year anniversary of The Data Literacy Score, a team-based assessment developed by our CEO and Co-Founder Ben Jones. After two years, we felt we finally had enough data to dive into the results and see what insights we could garner from analyzing the over 2,000 individual responses that have gone into this assessment to date. Responses came from dozens of teams all over the world in varying industries including nonprofits, government agencies and for-profit companies. Our hope is that these insights will be helpful in your own quest to build more data savvy teams.
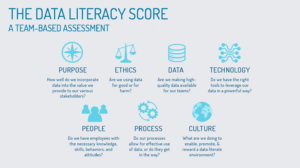
How is The Data Literacy Score Team-Based Assessment structured? The Assessment includes 50 different statements broken up into 7 categories, which are detailed in the image above. The statements are scored by respondents according to how well they feel they apply to their team at that moment in time.
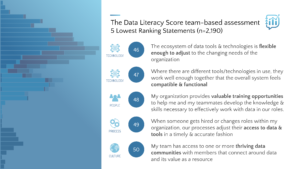
Below you’ll find the 5 statements that scored the lowest, statements we’re calling the top 5 data pain points, and the questions we should be asking as a result. Our goal in doing so is to identify the common data pain points that organizations we’ve worked with have faced and our recommendations for addressing them.

Read on or watch this 10-minute video of Data Literacy CEO Ben Jones sharing insights gleaned from uncovering these five most common data pain points!
The Fifth Lowest Scoring Statement falls in the Technology category and tells us that though tools should empower and enable us to make use out of data, many people feel constrained or limited by them as they look to use data to get their jobs done. As we brainstorm a path forward the question becomes, what are we doing to build flexibility? Think of dashboards built for yesterday’s situation, for yesterday’s goals and requirements. Dashboards that don’t tell you what you need to know today. What are we doing to allow for change and to accommodate that change within the tools and technologies that we offer to our team members?
The Fourth Lowest Scoring Statement also falls in the Technology category and tells us that though the tools at our disposal have evolved over the last decade, in many cases they’ve evolved on separate paths. They haven’t always evolved together so as to be interoperable, which leads to a lot of friction and inefficiency. The question organizations and teams should be asking is “Which interfaces are particularly cumbersome and how can we build bridges between those systems and tools so that our team members feel like they have a chance to make it through this data landscape relatively unscathed?”
The Third Lowest Scoring Statement falls in the People category and tells us that a common data pain point amongst employees is feeling like they don’t have access to adequate training opportunities to develop the knowledge and skills necessary to effectively work with data. Take for example a situation where Tableau is rolled out to a new department. All of a sudden employees have convenient access to a ton of valuable data, but do they have the skills to effectively use this data to generate wisdom and make data-informed decisions? If not, the end result could be under utilization of a sophisticated tool that should have been complemented by training opportunities just as sophisticated. Keep in mind that the buck doesn’t stop at offering great training opportunities and experiences for your team members. Folks also need to be aware of their availability and feel they have the breathing room to take advantage of them.
The Second Lowest Scoring Statement falls in the Process category and tells us that if an organization is investing heavily in data tools and recruiting top data talent, they should put an equally strong focus on the processes that support those investments so they don’t end up being roadblocks preventing talented people from putting data to good use in a timely fashion. To identify any roadblocks, begin by identifying the steps involved in the process and who is responsible for what. It sounds simple, but the larger the organization the more difficult this can be and it’s a frustrating and avoidable experience for someone to be waiting on access to data, which is why we believe we see this statement scoring so low.
The Lowest Scoring Statement falls in the Culture category and tells us that the number one data pain point at the organizations we’ve worked with is many employees feeling frustrated by the lack of a thriving data culture and community where they can connect with colleagues around data and its value as a resource. The good news is, it’s not a huge lift to get a data community started. To begin, assign someone the task of organizing different events. These could be tool-based user groups, a data book club, or a lunchtime meetup group with speakers to share success stories and best practices. The key is to make it optional. If you build small data communities, people will get the message that data matters and will get involved over time.
How well does your team speak the language of data? If you think The Data Literacy Score Team-Based Assessment can help you benchmark your own team’s maturity, reach out to us via the contact form at the bottom of this page!
Never miss an opportunity to level up your data skills and subscribe to the Data Literacy newsletter.


