Data Literacy for U.S. Voters

Part 3: Understanding Election Polls
This is the third part of our blog post series, Data Literacy for U.S. Voters.
- In the first part, we touched on the timing of U.S. elections, from the White House all the way down to your local school board.
- In the second part, we tackled the rules for determining winners, featuring the tricky Electoral College.
In this third installment, we’ll learn about a topic you’ve likely heard a lot about, especially recently: election polls.
Polling plays a crucial role in U.S. elections, attempting to provide a view into voter preferences. There’s no doubt that polls have a huge influence on campaign strategies, and potentially also on voter turnout. Let’s explore the different types of polls, how they work, and some important concepts to keep in mind when interpreting poll results.
Types of Election Polls
Several types of polls are commonly used during election seasons:
- Opinion Polls: These surveys gauge public sentiment on various issues and candidates. They help campaigns understand voter priorities so they can tailor their messaging accordingly.
- Straw Polls: Informal, non-scientific polls often used at events or within specific groups. While not statistically rigorous, they can provide early indications of trends.
- Entrance Polls: Conducted before voters enter polling stations, they offer a snapshot of voter intentions and can help forecast results.
- Exit Polls: Similar to entrance polls, but conducted as voters leave polling stations, these surveys provide insights into voter behavior and help analysts predict election outcomes before official results are available.
- Push Polls: These are NOT true polls but are designed to sway public opinion under the guise of polling. Push polls present biased or leading questions that are meant to influence the respondent’s views rather than measure them.
How Polls Work
Modern polling employs various methods to collect data:
- Online Polls: Respondents are invited to participate in a survey through email, social media, or other online platforms. Some online polls use opt-in panels, where participants volunteer to take surveys regularly. These are quick and cost-effective, but they often have issues with representativeness – how well a sample of people surveyed in a poll reflects the larger population of voters that the poll aims to represent.
- Telephone Polls: Pollsters contact individuals by phone, using random digit dialing (RDD) to reach a representative sample. Respondents answer questions verbally. These are seeing declining response rates, especially for landlines. Still used, especially for political surveys, but declining in popularity due to changing communication habits.
- Mail-in Polls: Pollsters send questionnaires by postal mail, and respondents fill them out and return them. These are slower, but they can reach demographics less accessible online or by phone.
- Face-to-Face (In-Person) Interviews: Pollsters meet respondents in person to conduct interviews, typically at public places or in people’s homes. This method is common in exit polls or in areas where phone or internet penetration is low. It is also typically expensive and much more time-consuming than other methods.
Good pollsters use random sampling in an attempt to make sure their results are representative of the larger population. But polling is not an exact science. By definition, we are trying to infer the properties of a population by collecting data from a subset of that population, namely, a sample. Here we enter into the realm of inferential statistics.
Surveys, Sampling, and Statistical Analysis
Polls are a type of survey, which is a method of gathering information from a subset of a population. In the context of elections, the population is typically all eligible voters, while the sample is the group of people actually polled.
- Sample vs. Population: A sample is a subset of a larger population. In contrast, a census attempts to survey the entire population. While a census provides the most accurate data, it’s often impractical for large populations, hence the use of sampling in polls.
- Inferential Statistical Analysis: This is the process of using data from a sample to make estimates and predictions about the larger population. It’s the foundation of modern polling, allowing pollsters to draw conclusions about voter preferences based on relatively small samples.
Understanding Margin of Error
The margin of error represents the range within which the true population value is likely to fall. For example, if a poll reports 52% support for a candidate with a ±3% margin of error, it means the actual support in the full population could reasonably be anywhere between 49% and 55%.
Here are some key points to understand about margins of error:
- It’s typically larger than reported: The margin of error usually only accounts for sampling error. In reality, other factors like non-response bias can increase the total error. A good rule of thumb is to roughly double the reported margin of error for a more realistic estimate of uncertainty.
- It grows for subgroups: The margin of error increases for smaller subgroups within a poll. For example, if a poll of 1,000 people includes only 150 Hispanic voters, the margin of error for that subgroup will be much larger than for the overall sample.
- It’s larger for differences between candidates: When looking at the gap between two candidates, the margin of error is approximately twice as large as for an individual candidate’s numbers
A Practical Example
Let’s say a poll shows:
- Candidate A: 48%
- Candidate B: 45%
- Margin of error: ±3%
At first glance, it might seem Candidate A is leading. However, accounting for the margin of error:
- Candidate A’s true support could be between 45% and 51%
- Candidate B’s true support could be between 42% and 48%
Given this overlap, we can’t confidently say who’s actually ahead based on this poll alone.
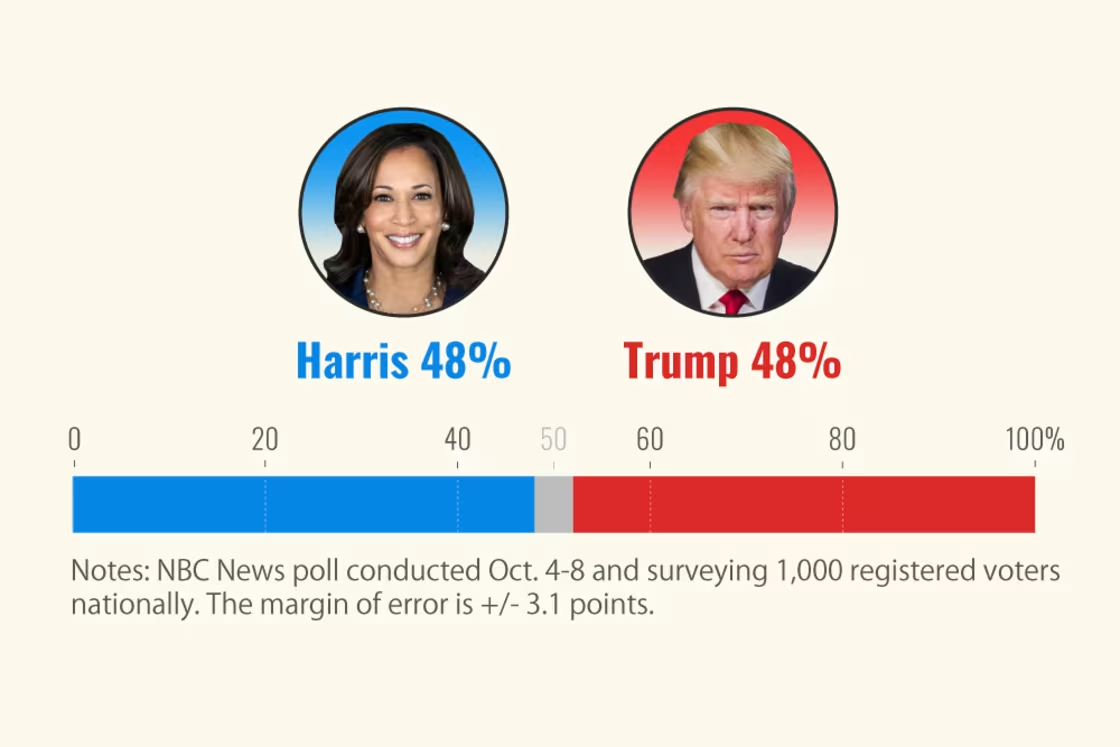
For a real-world example, NBC News published on October 13th that Kamala Harris and Donald Trump are locked in a “dead heat.” This claim was based on an NBC News poll of 1,000 registered voters, conducted between October 4-8th. Each candidate received a favorability rate of 48%, and NBC News reported that “the margin of error is ± 3.1 points”

Historical Lesson: Truman vs. Dewey
The 1948 presidential election between Harry Truman and Thomas Dewey provides a famous cautionary tale about relying too heavily on polls and predictions.
Virtually every prediction indicated that incumbent President Truman would be defeated by Republican Thomas E. Dewey. The Chicago Tribune was so confident in Dewey’s victory that they printed the now-infamous headline “DEWEY DEFEATS TRUMAN” before all votes were counted.

However, Truman won the election with 303 electoral votes to Dewey’s 189. This upset victory demonstrated the limitations of polling and the importance of waiting for actual election results.
Several factors contributed to this polling error:
- Polls stopped too early, missing Truman’s late surge in popularity.
- Pollsters underestimated voter turnout among Truman’s supporters.
- The impact of Truman’s vigorous campaigning was underestimated.
- Sampling bias due to the reliance on telephone surveys, which were not as ubiquitous then, particularly among lower-income Americans who tended to support Truman.
While this historical example reminds us to approach poll results with caution, it’s important to note that polling techniques and analysis have improved significantly since 1948. Modern polls, when conducted properly, tend to be more accurate, though occasional high-profile misses still occur.
Resources
Here are a handful of helpful online resources related to election polls:
- American Association for Public Opinion Research: AAPOR
- Pew Research Center: U.S. Politics & Policy
- Pew Research Center: 5 key things to know about the margin of error in election polls
- FiveThirtyEight: Latest Polls
- Gallup: 2024 U.S. Presidential Election Center
Common Misconceptions
Here are a few common misconceptions about the way election polls work:
- “Polls guarantee future outcomes.” WRONG: Polls are snapshots of public opinion at a specific time, not guarantees of future results.
- “All polls are equally reliable.” WRONG: The quality of polls can vary greatly depending on methodology and sample size.
- “A candidate leading in polls will win.” WRONG: Polls have margins of error and can change quickly, especially close to election day.
- “The margin of error applies to the difference between candidates”:
- Misconception: People often believe the margin of error applies equally to the difference between two candidates’ percentages.
- Reality: The margin of error applies to each candidate’s individual percentage, not the difference between them. The margin of error for the difference between two candidates is larger.
Critical Thinking Points
As you navigate the election calendar, ask yourself:
- How might the method of polling (phone, online, in-person) affect the results?
- What demographic groups might be under- or over-represented in a given poll?
- How can we balance the value of polling information with its potential to influence voter behavior?
- In what ways has social media changed the landscape of political polling?
Next up in our series: we’ll consider a favorite topic: the importance of SWING STATES in U.S. presidential elections. Stay tuned!


