Hands-On Public Workshop: Data Storytelling for IMPACT
A Virtual Workshop Tailored Specifically for Business Professionals
Learn by Doing: Build & Present Data Story
This isn’t another passive webinar. You’ll learn a proven storytelling framework, apply it to your own work, and get personalized feedback to improve it. If you’re a business professional who needs to communicate your data in a succinct, relevant presentation, then you this virtual workshop is for you.
By the end of the week, you’ll have:
✔️ A clear data story tailored to your audience
✔️ A repeatable method you can use for any future project
✔️ A chance to present and get feedback in a safe, supportive space
_
What’s Covered in the Training?
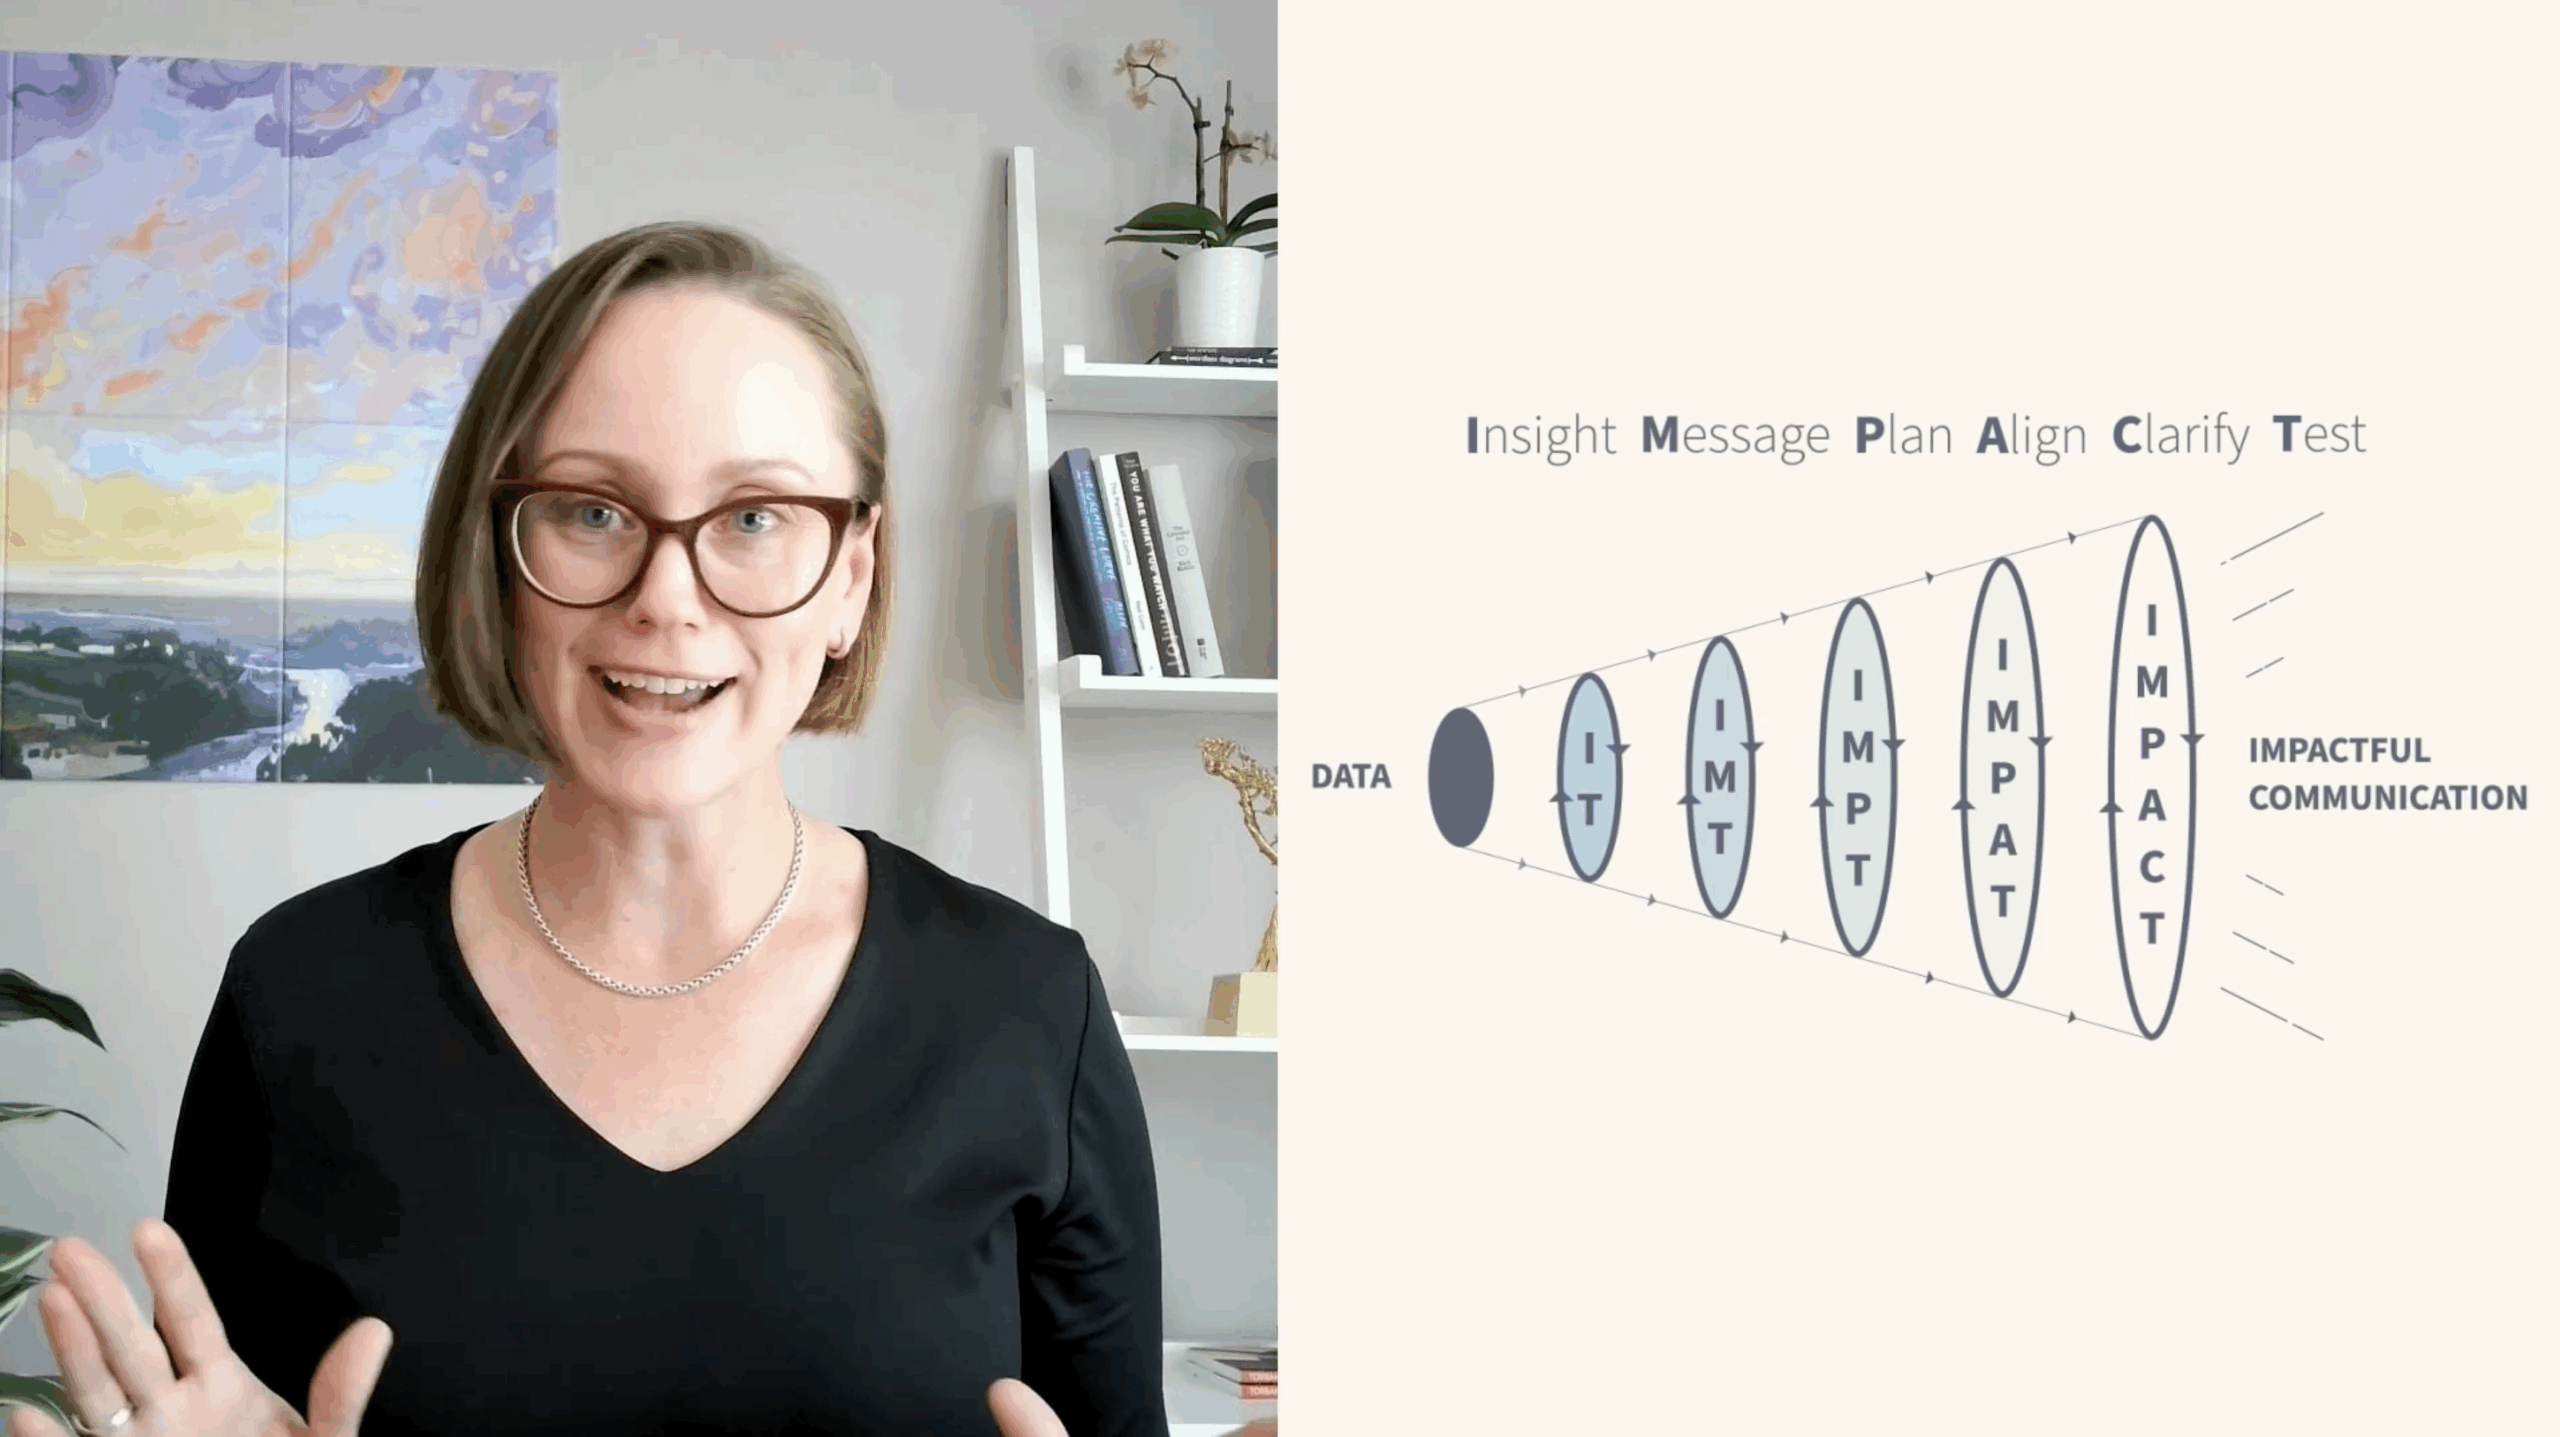
Each of the six lessons follow the IMPACT Framework to create a data story:
- Lesson 1: Insight – Identify what’s worth sharing
- Lesson 2: Message – Craft a clear, audience-relevant message
- Lesson 3: Plan – Storyboard your narrative for flow and clarity
- Lesson 4: Align – Choose visuals that highlight your key message
- Lesson 5: Clarify – Polish your design for clarity and consistency
- Lesson 6: Test – Practice your delivery and make final refinements
Your instructor, Alli Torban, will guide you through each step of the IMPACT framework in detail. Along the way, you’ll apply what you’ve learned to your own project, either on your own or in breakout groups. Midweek, you can join an optional office hour for extra support. On the final day, you’ll have the chance to practice presenting your data story (or share the progress you’ve made). It’s a supportive space where we’re all here to celebrate your efforts.
_
📆 Workshop Schedule
-
Monday, Oct. 27
🕐 1–3 PM ET
Live Workshop: I.M.P. – Insight, Message, Plan (story structure) -
Tuesday, Oct. 28
🕐 1–2 PM ET
Office Hours (optional): Project Q&A + Personalized Coaching -
Wednesday, Oct. 29
🕐 1–3 PM ET
Live Workshop: A.C.T. – Align, Clarify, Test (visuals + feedback) -
Thursday, Oct. 30
🕐 1–1:30 PM ET
Showcase: Optional attendee presentations
You’ll be working on your own project throughout the week and have the chance to present your story by Thursday. Presenting is optional, but incredibly rewarding! If you don’t have your own project to work on, I’ll share sample data to work with.
_
What’s Included
- Access to the full on-demand IMPACT course ($145 value)
- A re-usable Data Storytelling for IMPACT Workbook (fillable PDF format)
- A 30-minute 1:1 coaching session with Alli ($100 value, redeem any time!)
- A digital comic book on data storytelling concepts ($15 value)
- Workshop recordings so you can catch up if needed
- Personalized feedback on your data story as you build it
_
Who This Is For
This workshop is designed for business professionals who want to practice real data communication. You’re in the right place if you want to become more influential when you’re presenting insights to leadership.
Whether you’re using Excel, PowerPoint, Tableau, or just a sketchpad, the skills are tool-agnostic and immediately useful.
_
Why It Works
-
Small group = you get real feedback
-
Real-world application = you leave with something useful
-
Live interaction = you’re not learning alone
-
Optional presentation = build your confidence in a low-stakes setting
It’s the perfect mix of structure, support, and space to practice.
_
FAQs
What’s my expected time commitment?
You’ll want to set aside about 6 hours across the week. This includes two 2-hour live workshops, an optional 1-hour office hour, and a 30-minute optional showcase. In addition, you may spend 1–2 hours outside of sessions working on your data story. The more you put into it, the more you’ll get out, but we’ve designed the experience to be manageable for busy professionals.
What tools do I need?
Use whatever tool you’re comfortable with: Excel, Tableau, PowerBI, Google Slides, even pen and paper.
Do I have to present at the end?
Nope! But it’s encouraged. You’ll get more out of the experience with feedback. Even if you don’t want to present, feel free to join the presentations as an audience member to cheer on your fellow students.
Do I need my own data?
Using your own data is highly recommended, because it makes the workshop more relevant and actionable for you. Just be sure to choose a dataset you’re already familiar with and have a general insight in mind. Since we only have a week together, there won’t be time for data analysis. This workshop is focused on communicating your insights to a specific audience. If you don’t have a data set ready to use, we’ll provide a simple data set and an insight to get you started.
What do I need to have ready before the training starts?
Before the first session, make sure you have a dataset in mind that you already know well. You’ll also want a general idea of the insight you’d like to communicate. This will help you dive straight into crafting your story without getting stuck in analysis mode. If you don’t have your own data, don’t worry, we’ll provide a sample dataset and insight that you can use. Also, come prepared with the tool of your choice (Excel, PowerPoint, Tableau, etc.), and make sure your Zoom setup is ready for screen sharing and breakout rooms.
What if the information in my data story is proprietary or can’t be shared without an NDA?
No problem at all! You’re welcome to keep sensitive details private. Many participants use anonymized, summarized, or hypothetical versions of their real data to protect confidentiality. If you’re concerned about sharing during group discussions, you can opt to work solo or ask questions in more general terms. You can also choose not to present at the end, and you’re still welcome to join the presentation session to watch others!
What if I miss a session?
All sessions are recorded and shared with attendees.
Do I have to turn my camera on?
Yes, please! It helps us build trust in our small group. But if you really can’t, that’s alright.
Time zone doesn’t work for me?
Join the waitlist and tell us your preferred time. We’re planning more cohorts soon!
What happens after I register?
We’ll send you a welcome message with the Zoom calendar invitations. Reply any time with questions.
Any other questions?
Shoot us a message!
_
Ready to turn your data into an impactful data story?
You don’t need to be a designer or data wizard to tell a data story that impacts your business. You just need a process and a place to practice.
When: October 27th – 30th, 2025
Where: Online (Zoom)
Price: $495 per person
Group Size: Only 10 seats (small on purpose, so you get real feedback)
_
About Your Instructor
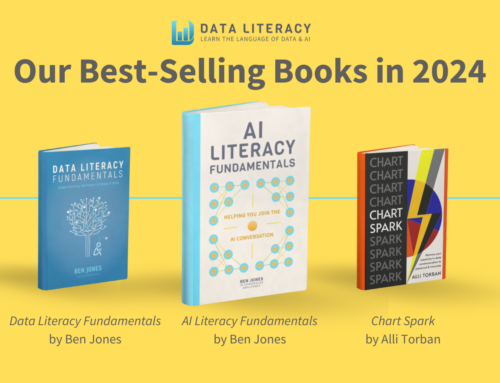
Alli Torban is the Senior Data Literacy Advocate at Data Literacy, LLC with more than 15 years of experience solving complex data challenges for government agencies, research institutes, and corporate clients. Alli possesses technical expertise in data communication and a demonstrated talent for combining data and design in an inclusive way, making her a highly effective information designer and trainer. Her efforts to share her knowledge on her popular podcast, Data Viz Today, earned her the Impactful Community Leader award from the Data Visualization Society. Alli’s also the author of Chart Spark (Data Literacy Press, 2023).
Hands-On Public Workshop: Data Storytelling for IMPACT
A Virtual Workshop Tailored Specifically for Business Professionals

Learn by Doing: Build & Present Data Story
This isn’t another passive webinar. You’ll learn a proven storytelling framework, apply it to your own work, and get personalized feedback to improve it. If you’re a business professional who needs to communicate your data in a succinct, relevant presentation, then you this virtual workshop is for you.
By the end of the week, you’ll have:
✔️ A clear data story tailored to your audience
✔️ A repeatable method you can use for any future project
✔️ A chance to present and get feedback in a safe, supportive space
_
What’s Covered in the Training?
Each of the six lessons follow the IMPACT Framework to create a data story:
- Lesson 1: Insight – Identify what’s worth sharing
- Lesson 2: Message – Craft a clear, audience-relevant message
- Lesson 3: Plan – Storyboard your narrative for flow and clarity
- Lesson 4: Align – Choose visuals that highlight your key message
- Lesson 5: Clarify – Polish your design for clarity and consistency
- Lesson 6: Test – Practice your delivery and make final refinements
Your instructor, Alli Torban, will guide you through each step of the IMPACT framework in detail. Along the way, you’ll apply what you’ve learned to your own project, either on your own or in breakout groups. Midweek, you can join an optional office hour for extra support. On the final day, you’ll have the chance to practice presenting your data story (or share the progress you’ve made). It’s a supportive space where we’re all here to celebrate your efforts.
_
📆 Workshop Schedule
- Monday, Oct. 27
🕐 1–3 PM ET
Live Workshop: I.M.P. – Insight, Message, Plan (story structure) - Tuesday, Oct. 28
🕐 1–2 PM ET
Office Hours (optional): Project Q&A + Personalized Coaching - Wednesday, Oct. 29
🕐 1–3 PM ET
Live Workshop: A.C.T. – Align, Clarify, Test (visuals + feedback) - Thursday, Oct. 30
🕐 1–1:30 PM ET
Showcase: Optional attendee presentations
You’ll be working on your own project throughout the week and have the chance to present your story by Thursday. Presenting is optional, but incredibly rewarding! If you don’t have your own project to work on, I’ll share sample data to work with.
_
What’s Included
- Access to the full on-demand IMPACT course ($145 value)
- A re-usable Data Storytelling for IMPACT Workbook (fillable PDF format)
- A 30-minute 1:1 coaching session with Alli ($100 value, redeem any time!)
- A digital comic book on data storytelling concepts ($15 value)
- Workshop recordings so you can catch up if needed
- Personalized feedback on your data story as you build it
_
Who This Is For
This workshop is designed for business professionals who want to practice real data communication. You’re in the right place if you want to become more influential when you’re presenting insights to leadership.
Whether you’re using Excel, PowerPoint, Tableau, or just a sketchpad, the skills are tool-agnostic and immediately useful.
_
Why It Works
-
Small group = you get real feedback
-
Real-world application = you leave with something useful
-
Live interaction = you’re not learning alone
-
Optional presentation = build your confidence in a low-stakes setting
It’s the perfect mix of structure, support, and space to practice.
_
FAQs
What’s my expected time commitment?
You’ll want to set aside about 6 hours across the week. This includes two 2-hour live workshops, an optional 1-hour office hour, and a 30-minute optional showcase. In addition, you may spend 1–2 hours outside of sessions working on your data story. The more you put into it, the more you’ll get out, but we’ve designed the experience to be manageable for busy professionals.
What tools do I need?
Use whatever tool you’re comfortable with: Excel, Tableau, PowerBI, Google Slides, even pen and paper.
Do I have to present at the end?
Nope! But it’s encouraged. You’ll get more out of the experience with feedback. Even if you don’t want to present, feel free to join the presentations as an audience member to cheer on your fellow students.
Do I need my own data?
Using your own data is highly recommended, because it makes the workshop more relevant and actionable for you. Just be sure to choose a dataset you’re already familiar with and have a general insight in mind. Since we only have a week together, there won’t be time for data analysis. This workshop is focused on communicating your insights to a specific audience. If you don’t have a data set ready to use, we’ll provide a simple data set and an insight to get you started.
What do I need to have ready before the training starts?
Before the first session, make sure you have a dataset in mind that you already know well. You’ll also want a general idea of the insight you’d like to communicate. This will help you dive straight into crafting your story without getting stuck in analysis mode. If you don’t have your own data, don’t worry, we’ll provide a sample dataset and insight that you can use. Also, come prepared with the tool of your choice (Excel, PowerPoint, Tableau, etc.), and make sure your Zoom setup is ready for screen sharing and breakout rooms.
What if the information in my data story is proprietary or can’t be shared without an NDA?
No problem at all! You’re welcome to keep sensitive details private. Many participants use anonymized, summarized, or hypothetical versions of their real data to protect confidentiality. If you’re concerned about sharing during group discussions, you can opt to work solo or ask questions in more general terms. You can also choose not to present at the end, and you’re still welcome to join the presentation session to watch others!
What if I miss a session?
All sessions are recorded and shared with attendees.
Do I have to turn my camera on?
Yes, please! It helps us build trust in our small group. But if you really can’t, that’s alright.
Time zone doesn’t work for me?
Join the waitlist and tell us your preferred time. We’re planning more cohorts soon!
What happens after I register?
We’ll send you a welcome message with the Zoom calendar invitations. Reply any time with questions.
Any other questions?
Shoot us a message!
_
Ready to turn your data into an impactful data story?
You don’t need to be a designer or data wizard to tell a data story that impacts your business. You just need a process and a place to practice.
When: October 27th – 30th, 2025
Where: Online (Zoom)
Price: $495 per person
Group Size: Only 10 seats (small on purpose, so you get real feedback)
_
About Your Instructor
Alli Torban is the Senior Data Literacy Advocate at Data Literacy, LLC with more than 15 years of experience solving complex data challenges for government agencies, research institutes, and corporate clients. Alli possesses technical expertise in data communication and a demonstrated talent for combining data and design in an inclusive way, making her a highly effective information designer and trainer. Her efforts to share her knowledge on her popular podcast, Data Viz Today, earned her the Impactful Community Leader award from the Data Visualization Society. Alli’s also the author of Chart Spark (Data Literacy Press, 2023).


