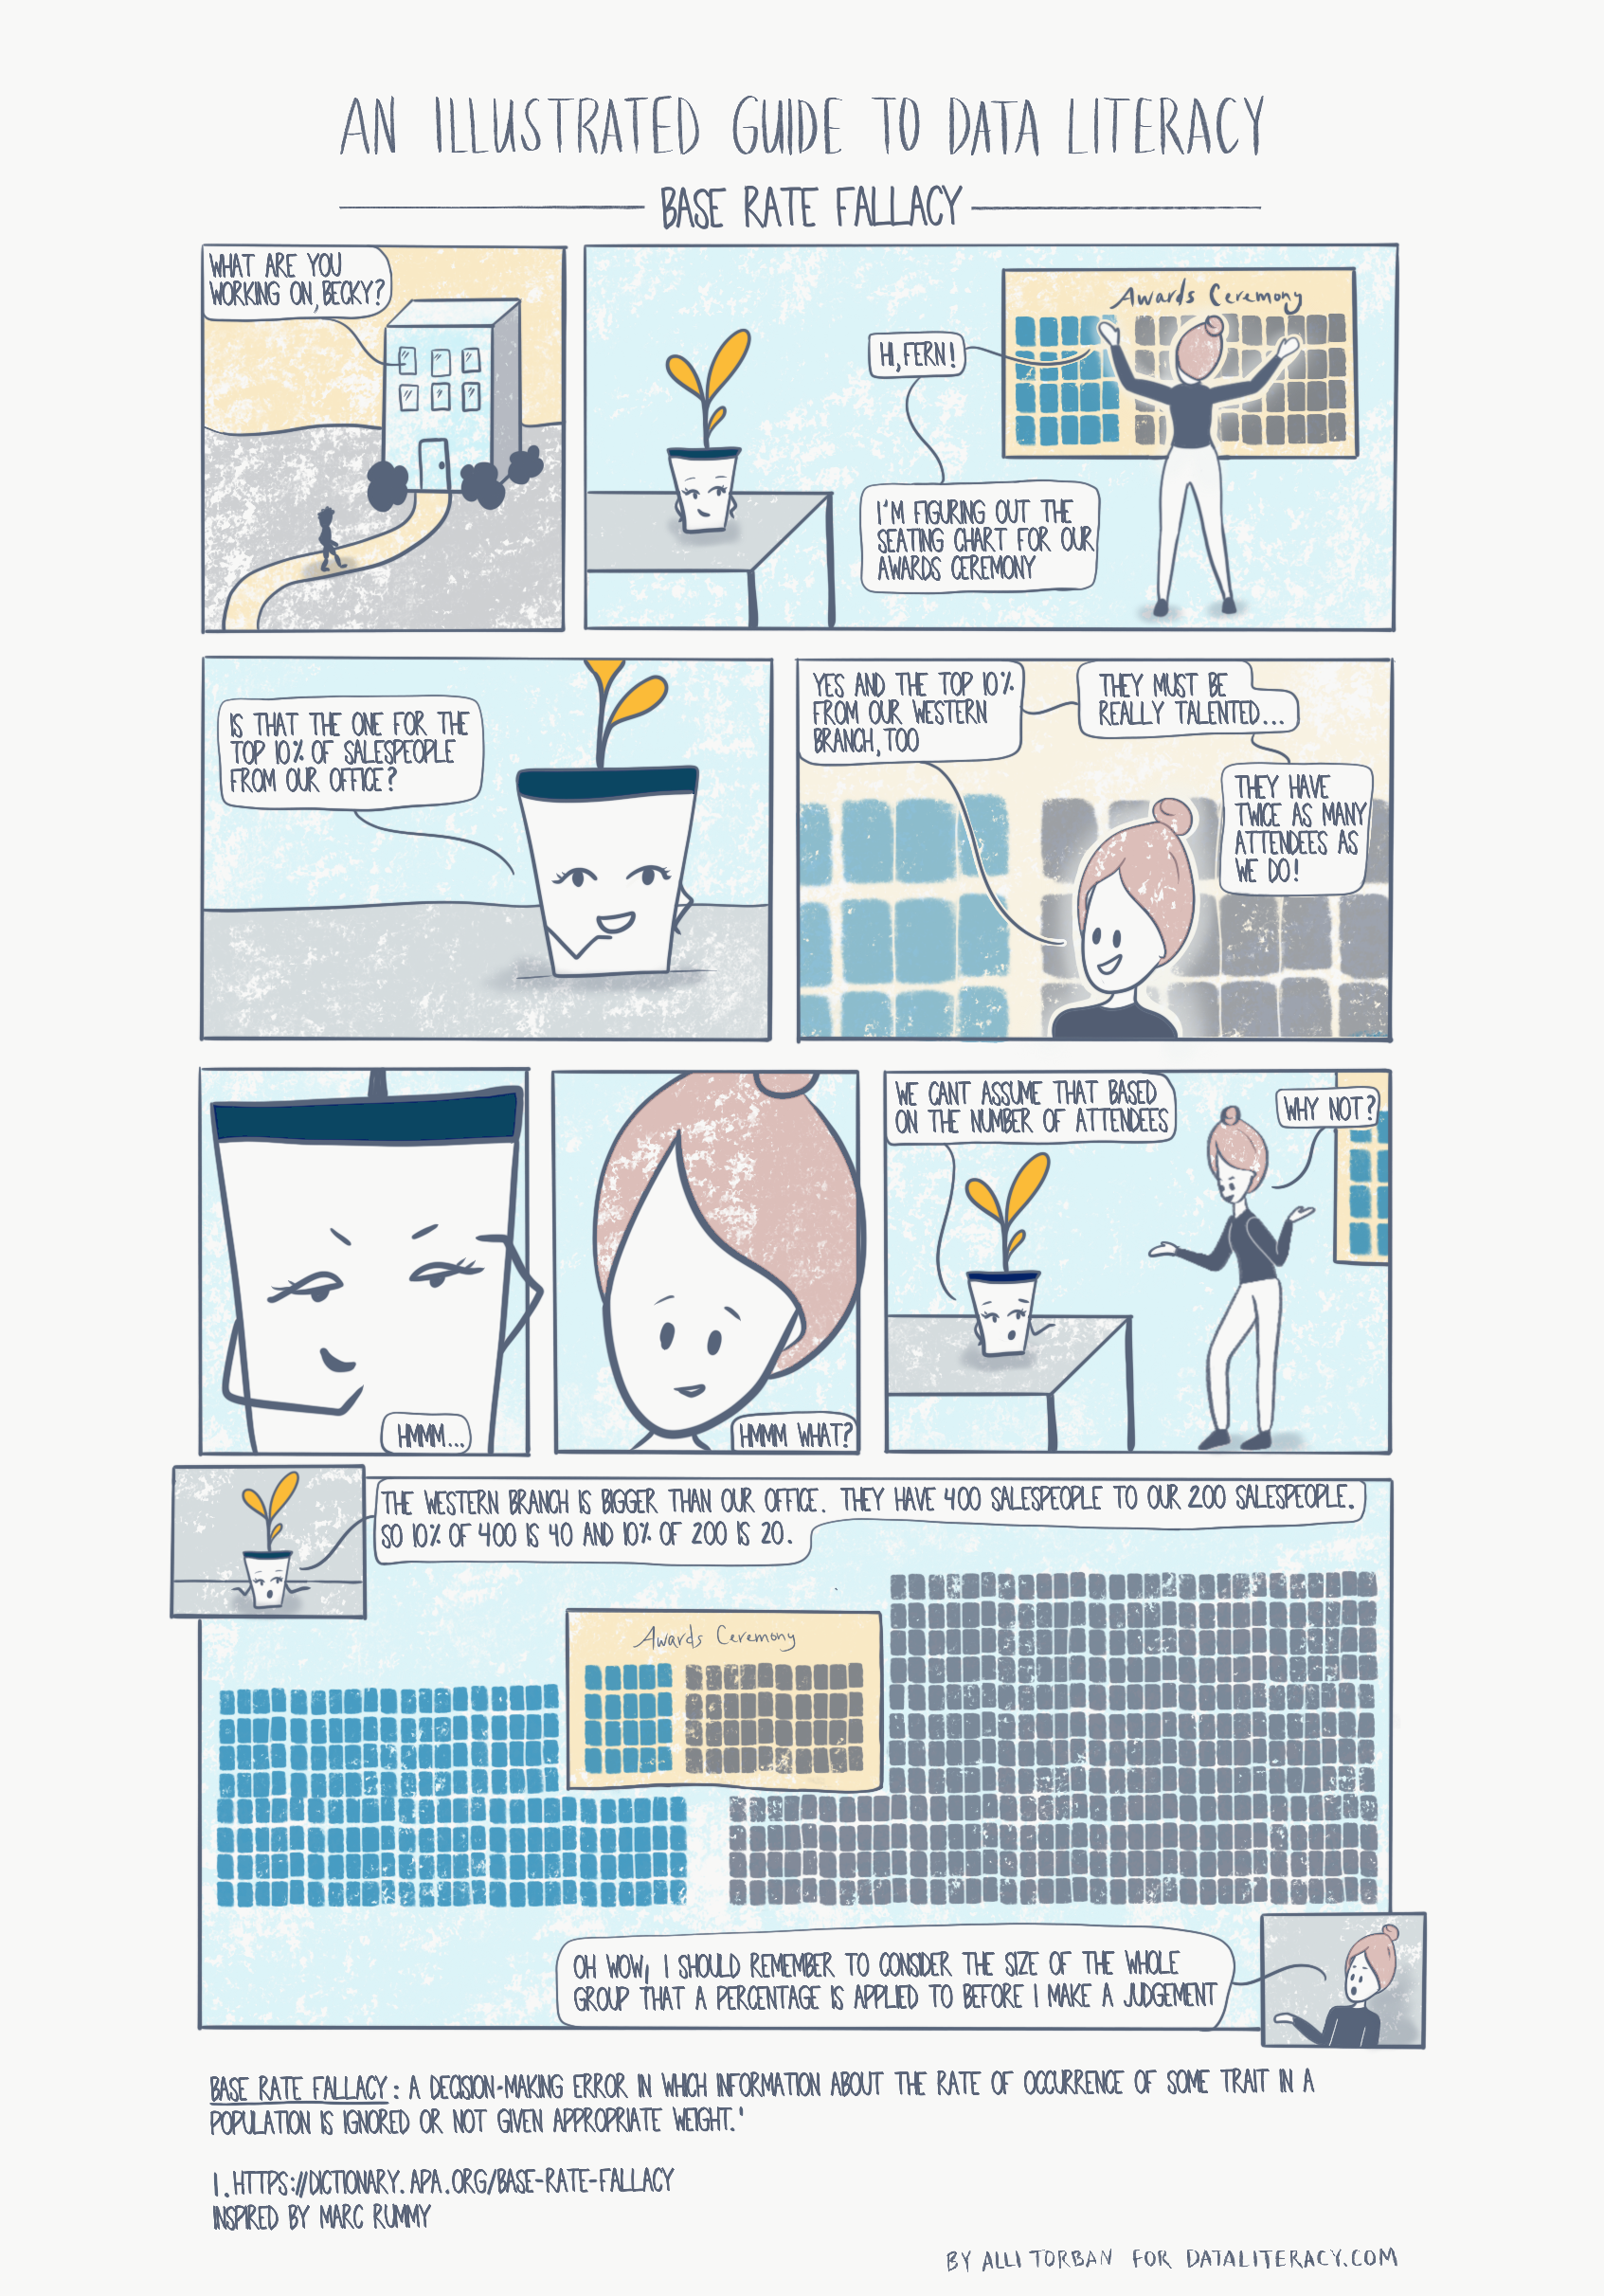
An Illustrated Guide to Data Literacy:
Base Rate Fallacy
Welcome back to our comic series that explores a range of data literacy concepts. We follow Becky, who describes herself as a bit data-phobic, as she navigates tricky situations at her new job. She’ll learn to create effective charts, grasp statistical concepts, and confidently clean data for analysis with the help of her faithful desk plant Fern.
Catch up on past comic strips: Pie Charts and Bias in Research

If you know anyone who would enjoy following Becky’s journey becoming a confident data communicator, then please feel free to share this comic series!

Alli Torban is a contributor to Data Literacy LLC. She’s an Information Design Consultant based in Washington, D.C., and hosts the podcast Data Viz Today. Alli specializes in designing data visualizations for researchers to help get their work understood by a wider audience. She enjoys creating whimsical patterns and spending time with her husband and two daughters.

