Asking Worthwhile Questions of Your Data
Written by Ben Jones
In order to become skilled at using data, there’s one attribute we all need to develop, no matter what industry we’re working in, and no matter what data tool we’re working with:
We need to learn how to ask worthwhile questions of our data.
This skill is a critical thinking skill, not an Excel skill, an SQL skill, or a Tableau skill. The good news is that if you learn this skill, you can use it no matter what data-working tool you use. Sound data thinking isn’t just tool-agnostic, it’s tool-transcending.
We live in the world our questions create. -David Copperrider
There is some bad news though. This critical skill isn’t often covered in tool-based trainings that you find online. We cover it in our Data Literacy Level 2 course, and my latest book, Read, Write, Think Data. That’s exactly why we created this learning material in the first place: to help you go beyond tool training and learn the process of working effectively with data.
If you can’t describe what you are doing as a process, you don’t know what you’re doing. -W. Edwards Deming
Start with a worthwhile question about the real world
In order to ask worthwhile questions of data, we need to be able to first ask worthwhile questions about the real world. How do you know whether a question about the real world is “worthwhile” though? Worth and value are highly subjective, aren’t they? What’s worthwhile for one person to do might be a total waste of time to someone else. An object of extreme value to me might be worthless to you.
So you have to define this yourself, and you have to get good at sniffing it out in different contexts: at work, at home, in your community, in the broader world. What matters most, in each of these contexts, at any given time?
For questions related to your place of work, this is where business acumen comes in, and this is where you can put your people skills and your listening skills to good use.
- What major problems are leaders within your organization trying to solve?
- What fears do you notice surfacing in conversations? Is there an urgent issue or “burning platform?”
- What possibilities seem to be getting people excited? Are there big opportunities to grasp?
- What’s currently changing in the environment? What changes might happen next?
Maybe there’s a concern about an emerging competitor in the marketplace. Maybe the company has become very cost conscious all of a sudden due to rising prices. Maybe layoffs or a product recall are looming large.
Pay attention to the “prevailing winds” blowing within the organization. The worthwhile questions will often be found swirling around in the wake of these winds.
Once you become aware of a critical issue or an upcoming shift, I recommend you behave like a journalist and ask the “5W’s and 1H” to gather more specific information about the matter at hand. The “5W’s and 1H” are classic questions that can be traced all the way back to Aristotle’s Nicomachean Ethics, written in 350 B.C.E. He called this list the “Septem Circumstantiae:”
- Who? – Who will be most impacted by an issue? Who can we delight by resolving an unmet need? Who can help us make something happen? Who….?
- What? – What are the root causes of a problem? What products account for most of our revenue? What…?
- When? – When did an issue take place? When did a trend begin (or end)? When do we anticipate a situation changing? When…?
- Where? – Where have we been most (or least) successful recently? Where did people go on our website? Where…?
- Why? – Why did we have to lay people off? Why did customers want refunds? Why have orders for a service decreased? Why…?
- How? – How can we reduce waste? How can we meet an unmet need? How did a situation arise? How…?
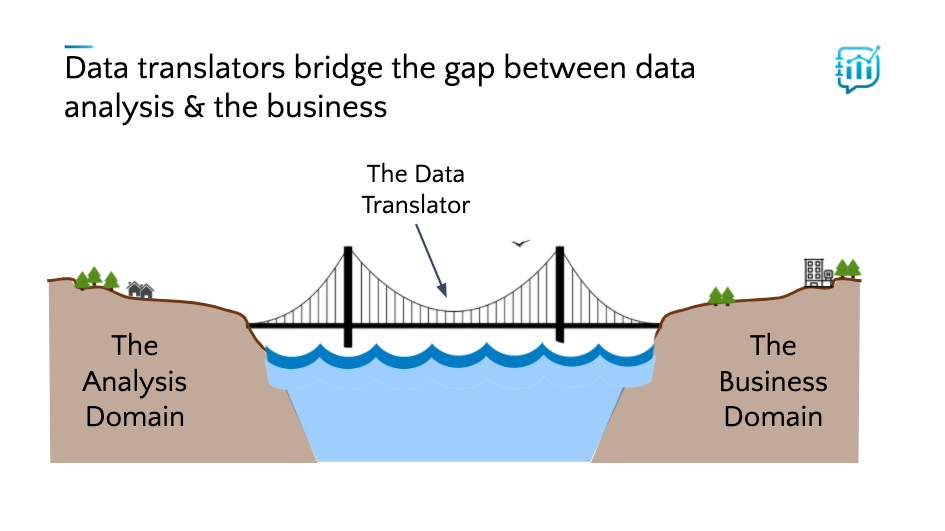
Now that you have refined your question that applies to the real world, you need to come up with a related question that you can ask of your data. This involves “data translation” in reverse: building a bridge between the BUSINESS DOMAIN and the DATA DOMAIN. This is a very critical skill, and one that will make you indispensable to those you are hoping to help.
A Dozen ‘Hows’ to Ask Your Data
The following 12 questions are a thought-starter for you to consider to bridge the gap from the business domain to the data domain. To illustrate each of them, we’ll use a fictional coffee shop example. Additionally, follow the provided links to discover chart types, tools, and guides that will help you answer each of these questions.
A Dozen ‘Hows’ to Ask Your Data
- Counting: How Many?
- How many total paying customers visited the coffee shop today?
- Consider using: KPI (Key Performance Indicator) or BAN (“Big Ass Numbers”)
- Measurement: How Much?
- How much money did we make on sales today?
- Consider using: KPI or BAN
- Tendency: How Typical?
- Distribution: How Varied?
- Part-to-Whole: How Comprised?
- Time-Based: How Variable?
- How variable was the daily volume of traffic to our website?
- Consider using: Line chart or area chart
- Comparative: How Similar?
- How similar are satisfaction levels of coffee by coffee bean type?
- Consider using: Bar chart (with error bars for sample data)
- Correlation: How Related?
- How related do cold drink sales and outside temperatures seem to be?
- Consider using: Scatter plot
- Proximity: How Close?
- How close do members of our “coffee bean of the month” live?
- Consider using: Symbol map
- Network: How Connected?
- How connected are our vendors, in terms of who does business with whom?
- Consider using: Network graph
- Probability: How Likely?
- How likely is it for gift card sales to surpass $10,000 this coming holiday season, based on historical orders?
- Consider using: Forecasting
- Causal: How Responsible?
- How responsible is water type for drink satisfaction scores?
- Consider using: Design of Experiments
What’s Next in the Process?
In the WISDOM Data-Working Flow that we teach in our Level 2 course, we move on from the Question step to the Hypothesis step. We stress the importance of actually writing down your guess about what the answer to your question will be. And then the process moves on to getting your hands on relevant data, at which point the data preparation fun begins!
Feel free to spread the word about the “Dozen Hows,” and if you’re ready to invest in your own data literacy journey, head on over to our training page where you can find the right course for you. Want training for your team? Fill out our team training inquiry form and we’ll get in touch with you to discuss pricing and options.

Ben Jones is the Co-Founder and CEO of Data Literacy, a training and education company that’s on a mission to help people learn the language of data. While leading the popular Tableau Public Platform for several years, Ben recognized the large gap between people’s knowledge of data and the data needed to do their job successfully and started Data Literacy to help address this urgent need. Ben teaches data visualization at the University of Washington Foster School of Business, he’s the author of Avoiding Data Pitfalls (Wiley, 2019), Data Literacy Fundamentals (Data Literacy Press, 2020) and Learning to See Data (DLP, 2020), The Introspective Entrepreneur (DLP, 2022) and Read, Write, Think Data (DLP, 2022). Ben has presented to, trained or worked with the highest level of the US Intelligence Community, United States Postal Service, NOAA as well as large pharmaceutical companies, global non-profit organizations and many more industries and organizations from big to small.
To balance out the digital side of things, he loves hiking and backpacking on the beautiful trails of the Pacific Northwest. Ben holds a BS in Mechanical Engineering from UCLA (2000) and an MBA from California Lutheran University (2011).

