How Making Data Physical Could Help Us Care for the Planet
In celebration of World Earth Day, we have a special guest post by data journalist Miriam Quick.

This story was originally published in Nightingale.
The city of Sheffield, UK, has long had a reputation for appalling air quality. Dominated by the smokestacks of steel plants during the 19th and 20th centuries, it suffered from regular ‘pea-souper’ smogs, so called because the air was yellow with sulphur dioxide and so thick with particulates you could not see more than a few metres in front of you.
Today the air pollution in Sheffield is harder to see. The particulates are smaller and mainly come from traffic, but the air is still deadly: air pollution kills an estimated 500 people in the city each year.
In 2015, Stefanie Posavec and I were commissioned by the Sheffield branch of the Open Data Institute to create a data art piece that would engage local people with this issue. The result was Air Transformed, two series of wearable data objects based on city air quality data. We made three necklaces, each representing a week’s particulate matter (PM10) measurements. The larger and spikier the ‘bead’, the dirtier the air.

Stefanie Posavec and Miriam Quick — Air Transformed (2015). Photo: Steve McInerny (https://sharpsharp.co.uk/).
(That big spiky orange bead? It’s the evening of Bonfire Night.)
Then we made three pairs of glasses, each representing a day of air quality readings, with three engraved lenses, one per pollutant (PM2.5, PM10 and NO2). The larger the pattern, the cloudier the wearer’s vision and the worse the air quality was that day.
They are tactile objects, designed to be worn. You can run your fingers over the necklaces and feel the beads change through smooth and sharp, mirroring how the air changed that week. We made them heavy because we wanted to show that pollution places a health burden on the body in a way people experience directly.

Stefanie Posavec and Miriam Quick — Air Transformed (2015). Photo: Steve McInerny (https://sharpsharp.co.uk/).
I was, and am, proud of our work. But at times I had doubts. We’d been commissioned to encourage people to care about air quality in Sheffield. Yet it felt like we were prettifying the problem; improving local bus services would have solved it more efficiently. And all that plastic we were using. Does making cool stuff out of environmental data change anyone’s mind, I wondered?
Since then, I have come to believe that physical data objects (let’s not use the word ‘physicalization’, it’s hideous) can play a role in helping people come to terms with the multiple and interlocking environmental crises we face. They may even make us more likely to do something about them.
Here are some ways they can do this:
1 / Make future climate scenarios feel less abstract

Jose Carlos Diaz chalks 6ft of sea level rise for HighWaterLine | Miami in 2013. Photo: Jayme Gershen.
We are surrounded by the earth’s environment at all times. Despite this, ‘the environment’ is often described in abstract terms (sometimes deliberately, to frame it as a peripheral issue for pot-banging special interest groups). The future impacts of climate change can feel distant and unreal. So artworks like Xavier Cortada’s Underwater Home Association (2018) draw data directly onto landscapes to illustrate how climate scenarios could play out in real spaces where people live and work. Cortada placed numbered signs in front of houses in Miami, Florida showing how many feet of sea level rise would inundate each property. In low-lying Florida, that’s not many.
In Eve Mosher’s ongoing project HighWaterLine (2007-), community volunteers use a sports field marker to chalk out future flood zones caused by rising sea levels on city streets. The artwork has been made in Miami, Delray Beach Florida, New York, Philadelphia and Bristol, UK.
2 / Engage our bodies with the data
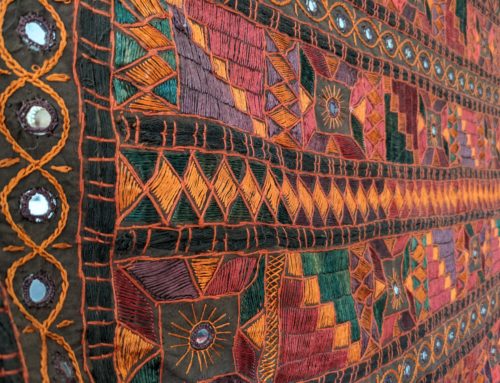
Some artworks translate environmental data into tactile and multi-sensory objects. They include textile pieces such as Mieka West and Sheelagh Carpendale’s Anthropocene Footprints (2018), which visualizes Canada’s carbon emissions as strange ritual-looking objects reminiscent of Incan quipus or Native American dreamcatchers. Or they draw on a handcrafted aesthetic, like Accurat’s 30-metre long tapestry-like data mural The Room of Change (2019).

Accurat — The Room of Change (2019). Photo: Gianluca Di Ioia
The Tempestry Project sends out kits containing yarn, city-level temperature data and instructions detailing how to make the data into tapestries. Each knitted or crotcheted row represents a day, each tapestry a year, and there’s a fixed system of colours. The results look like Climate Stripes, except made of wool.

Tempestries for (L) Utqiagvik, Alaska representing (L-R) 1925, 2010, and 2016 and (R) Death Valley, California representing (L-R) 1950 and 2016. Photo: Justin Connelly. CC BY-SA (https://creativecommons.org/licenses/by-sa/4.0).
You can see elements of political resistance in these craftivist acts of weaving weather data, often in groups, using traditionally ‘feminine’ fabrication techniques. Tempestries have even been used as banners on climate protests. They are a reminder that women, poor and indigenous people are being hit first and hardest by climate change.
3 / Break down emotional barriers
Some Tempestry makers say the repetitive, mindful focus of knitting the tapestries helps them cope with climate anxiety. Project co-founder Emily McNeil knits them to “channel anger over political inaction into something beautiful”. Knitters physically connect into the nuances of each locality’s fluctuating temperature patterns, selecting a new wool colour each time the thermometer hits a new high.

A Tempestry Kit for Atwood, Kansas. Photo: Justin Connelly. CC BY-SA (https://creativecommons.org/licenses/by-sa/4.0).
A parallel can be found in the work of textile artist Tali Weinberg, who weaves climate data into ‘datascapes’ that “merge a practice of record keeping with a practice of grieving”. The meticulous practice of gathering environmental data, of documenting the losses, and then representing it can be an act of care, even love. This can be painful (as scientists are finding), but also a cathartic process that helps to break down defensive boundaries and allow us to mourn for what is being lost. Species. Ecosystems. Mostly-normal weather.
4 / Remind us of what we have lost
Artist Sissel Tolaas works with smells. In Resurrecting the Sublime (2019), she and Dr. Alexandra Daisy Ginsberg created an interactive installation that recreates the aroma of extinct flowers. The version in London’s Wellcome Collection Being Human exhibition features a panel which, when rubbed, produces the aroma of Hibiscadelphus wilderianus, the flower of an extinct tree that once grew in Hawaii.
The scent of the flower comes from DNA extracted from three preserved specimens. Gingko Bioworks used synthetic biology to find gene sequences that might encode for fragrance-producing compounds. Then Tolaas found their closest chemical match. Transforming genetic data into a rich and evocative sensory experience, Resurrecting the Sublime brings back traces of an extinct species from the past. In the future, synthetic biology could bring back entire organisms but the artists write that their work is “not de-extinction”. Instead it invites us to “contemplate our actions, and potentially change them for the future”.
5 / Question our use of resources

Detail of Tali Weinberg’s Bound (i.5) (2019), showing annual average temperature data for 300 places around the world. Photo: Philip Maisel
An artwork has an ecological footprint, like any other artificial object, so artists working with environmental data often prefer low-impact materials, like wool or wood. Some artists use plastic deliberately and self-consciously: Tali Weinberg used “1,500 feet of petroleum-derived medical tubing” bound with “plant fibres dyed with plant and insect-derived dyes and mineral mordants” for her temperature data sculpture, Bound (2017–19). Others use discarded marine plastic, as in Steve McPherson’s Solar Returns (2019). A Drop in the Ocean, a community project led by Irene Soler in Brighton, UK, took every bottle top collected from the beach over eight months (a total of 29,684) and assembled them into a large colourful wave.
6 / Transform natural beauty into digital forms
A fascinating strand of digital art translates data from the natural world into dynamic artworks, like David Bowen’s Tele-present Water (2011), in which wave readings from a floating buoy sensor create the endlessly shifting forms of a suspended sculpture. Or his follow-up Tele-present Wind (2010-18), which feeds wind data into an installation made of dried plant stalks. Attached to tilting devices, they move along with the digital breeze.
The mass of wires in James Leng’s Point Cloud (2012) changes shape in response to the weather and in Daniel Canogar’s Echo (2017), LEDs react to data on air quality, volcanic activity and fires to create a multicoloured installation. These artworks transform the natural world into the digital. The hidden correspondence between these outside and inside spaces creates a kind of magic.
7 / Provoke delight and wonder
Some of the earliest data objects were practical. They helped people navigate around a particular place, such as the stick charts that show swell patterns made by the Marshallese before the Second World War. In the 1880s, Danish incomers to Greenland found Inuit people made tactile maps of Greenland’s coastline, which they used to tell stories.
Today, site-specific artworks can direct our attention towards the natural world anew. California-based artist Charles Sowers aims to “draw people into a careful noticing and interaction” of physical phenomena. His Solar Totems (2017) uses a lens to burn the sun’s rays into redwood logs, leaving a trace as it moves across the sky. “I seek to provoke a sense of delight and wonder and reward extended observation”, he writes.
Sowers’ work straddles the boundaries between data art and the non-data-driven land art of Andy Goldsworthy or Joseph Beuys, who planted 7,000 oak trees in the German city of Kassel. You could perhaps argue that Solar Totems is an analogue data artwork, whereas Ice Window (2014) probably isn’t, but in truth the boundary is a blurred one. Are the wind-responsive building facades made by Ned Kahn also data artworks? If so, perhaps a weather vane, a buoy, or a wind-shaped tree is too.
What comes next?
The climate and ecological crisis is the most profound emergency humans face. Art alone is not going to solve it, and nor will data. But by grounding us in direct experience, reminding us what we have already lost and inspiring wonder and delight about what remains, data artworks can begin to equip us with both the knowledge and the sense of urgency to act — and nurture a feeling of connection that makes acting seem worth the effort.
 Miriam Quick is a journalist, author, and musician known for her innovative and diverse approaches to communicating data. She collaborates on creating artworks that translate data into sound, images, and sculpture, which have been displayed at various museums and galleries around the world. In 2021, Miriam Quick, along with Duncan Geere, founded the data sonification studio, Loud Numbers. Initially, it began as a podcast that transforms data stories into musical compositions. Miriam Quick has also co-authored a book entitled, “I am a book. I am a portal to the universe.” The book, which she wrote with Stefanie Posavec, won the Royal Society’s Young People’s Book Prize in 2021 and an Information is Beautiful Award in 2022.