Pivot Into a Data Career: How My Journey Can Help You Start Yours

Alli Torban is a contributor to Data Literacy LLC. She’s an Information Design Consultant based in Washington, D.C. and hosts the podcast Data Viz Today. Alli specializes in designing data visualizations for industry experts to help get their work seen and understood by a wider audience. She enjoys creating whimsical patterns and spending time with her husband and two daughters.
__
Are you thinking about pivoting into a career in data? Does your first step feel daunting?
I know the feeling. A few years ago, I decided to pivot from a business analyst to a data visualization designer, and the whole process felt like I was driving aimlessly without a map. My journey is far from over, but when I can look back on my transition, I can see that there were a few key steps that yielded a high return.
Here, I’ll share those steps so you can confidently take a step toward your new data career. Let’s jump in!
__
First Step: Assess Your Constraints
If you had seen me at age 30, you would have seen a woman trying to savor the sweetness of a newborn and the boundless optimism of a toddler but secretly wondering how to jump back into the workforce.
The problem was that I needed a flexible schedule now with young kids, and I also didn’t find my career as a business analyst fulfilling, so what exactly was I going to jump back into? My choices seemed simultaneously boundless and non-existent. I had no idea how to move forward.
Lamenting to a friend one morning at preschool drop-off, she asked, “Do people in your field do freelance work?” Ah-ha! That was the word I needed to express a flexible schedule: freelance.
So I began searching the internet for variations on “Freelance Analyst”, and after many dead ends, I stumbled upon the job of “Freelance Data Journalist.” Jumping in with both feet, I created a project that was interesting to me and used my analyst skills. The project was about how much extra it costs to live within walking distance to the metro in D.C., and I generated isochrones around the metro stops to compare the sales prices inside and outside the isochrones. I pitched it to a local magazine and nearly dropped the phone when the editor said she’d buy it!
By the end of the project, I discovered two things: First, for all the time that I put into the piece, I was working for about $3/hour, so it seemed like freelance data journalism was going to be tricky to make a decent income. Second, I wasn’t that excited about the whole process except for the part at the end where I was visualizing the data…
This led me to searching the internet for phrases like “infographic creator”, and I discovered that there were jobs called “Data Visualization Designer”! Who knew? I felt like I was starting to get somewhere. The pivotal step that led me to this point was assessing my constraints and then using that as my jumping-off point.
Your Turn
The first step is difficult because there are so many options. I initially felt boxed in by my time constraint, but it turned out that using my constraint as a jumping-off point helped get me moving.
Use your constraints to your advantage by letting it limit your first steps. You can always reevaluate your constraints later.
Try this: List out two things that your career MUST HAVE:
- (e.g. flexible schedule)
- (e.g. data related)
__
Second Step: Connect with Others
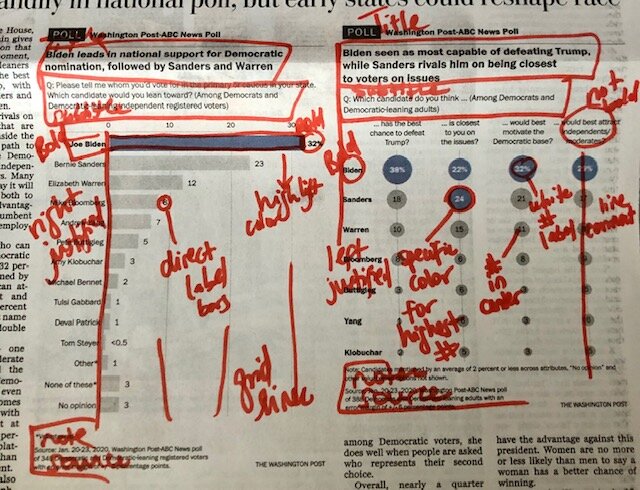
Now I was obsessed with data viz. I spent Sunday mornings cutting out charts from the Washington Post to tape in my notebook.
No book, blog post, or podcast was safe from me (these are my favorite resources, if you’re interested). But I found a hole in everything that I consumed: how do I actually learn the workflow of a successful data viz designer so I can become one?
Wouldn’t it be nice if there was a podcast that dissected the design process behind great data visualizations so I could learn the process while on the go?
On the treadmill one night, I jumped off mid-workout and ran to tell my husband, “It’s me! I can make the data viz podcast that I want to listen to!” He gingerly asked, “Do you know enough about data viz?”
He was right, but also, that was the point. I was coming at it with fresh eyes and fresh questions, so who better? There was still a twinge of doubt inside me that I might be out of my depth.
Sitting on the idea for a month, I finally realized that it hurt more to stand idle than to move in this direction and potentially be embarrassed. I bought the equipment and learned the logistics of podcasting. In March 2018, my sweaty hand clenched the mic as I recorded a 2-minute introduction episode. I uploaded it to an RSS feed and Data Viz Today was born!
A few years later, I’ve interviewed over fifty designers to learn about their toolkits, workflows, and advice. Far from embarrassing myself, the podcast has helped me connect to so many talented people in the field. Then I get to share that information with thousands of others who in turn connect with me.
Forming connections with people who are ahead, behind, and beside you is essential to finding your way on your journey. But don’t worry! I’m not suggesting that you start a podcast in order to pivot into a data career.
What I am suggesting is to find a way to connect with people in your new field. If you can find someone to agree to be your mentor, that’s ideal but really hard to come by. Rather than wait for the perfect person to cross your path, you can build your own virtual “Board of Directors.”
I first heard about this concept from Dorie Clark, and it’s brilliant! Identify a group of people whom you admire for different reasons and follow them virtually. Carve out time in your schedule to study the work they put out and what their path was like. They’ll never know that they’re on your board, but you’ll be soaking up all they have to offer.
This will help you discover relevant resources and get a taste for different roles in the field. It’s intimidating to try to “network” with people in a new sphere, so the virtual Board of Directors will ease you into it.
Your Turn
The first step helped you narrow the field a bit with your constraints, so now search for people doing inspiring work in the field interesting to you. Study the work they put out and seek to understand their path.
Try this: Identify three to five people who can be on your virtual “Board of Directors” and note what you admire them for:
- (e.g. Alberto Cairo: introspectiveness about the field and truthful charts.)
__
Third Step: Create Your Assets
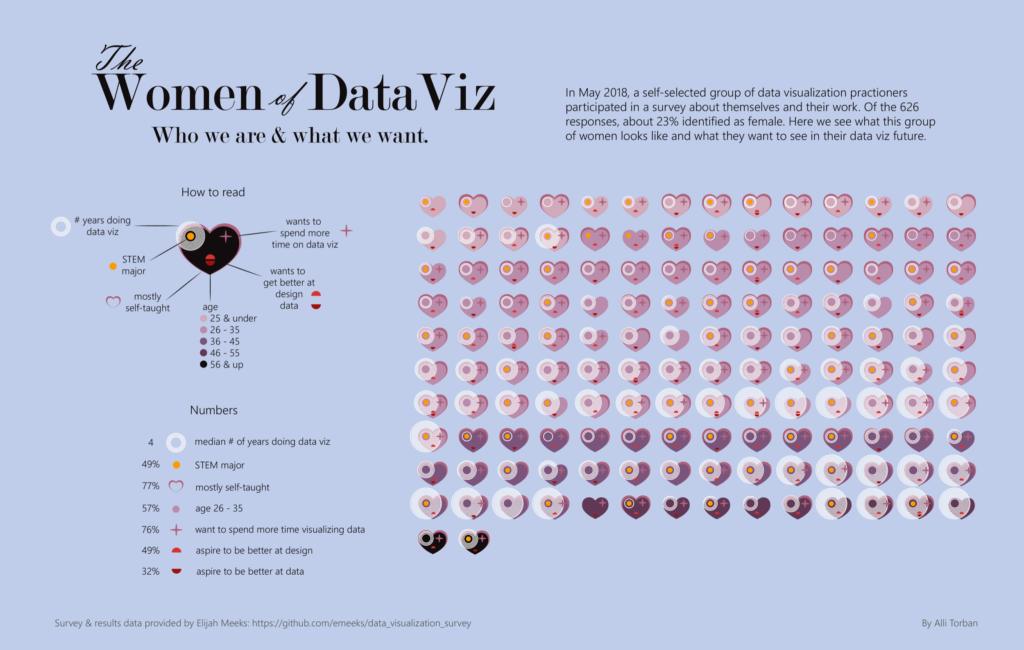
About six months after starting my podcast, I gathered enough confidence to create a unique data visualization and share it publicly. I spent hours working on it, and I was sure that someone would call me out as a fraud and a hack designer, but I shared it anyway.
The next few days were a roller coaster. Many people loved this unique take on the data. I swelled with confidence and felt like I was really doing it! But some critiqued the color choice as cliché, and one person even said it was THE worst visualization she’d ever seen. Ouch!
Nevertheless, I knew it took a lot of courage to create something and open myself up to critique, so I was proud of myself for that. My courage led to growth which led to progress.
I finally felt like I was a data visualization designer. I didn’t need anyone’s permission to be a data viz designer. I could just start designing and that in itself makes me a data viz designer. As Austin Kleon says, “Forget the noun, do the verb.”
I kept creating and sharing my work until I had about five strong pieces in my portfolio, and then I started applying to “Data Visualization Designer” jobs asking if they were open to a part-time applicant. Most companies weren’t open to part-time work, but I persisted.
In October 2018, I was hired as a part-time “Data Visualization Designer”! The time between my first experiment with data journalism to successfully pivoting into a flexible data career was about a year.
The essential step to complete my pivot was to create assets. I created visualizations for my portfolio, but your field might not be so visual. You can still create a project and write an article or make a video about it. I won’t sugar-coat it; this is a really tough step. Most people want to pivot into a new field, but they get stuck in tutorial-land, too scared to show their work and receive feedback.
But if you don’t create something, then you won’t know what you like about the process, you won’t know how to pivot, you won’t build a portfolio, and you won’t show an employer that you have what it takes to do the job.
Your Turn
It’s time to start creating to put your skills to the test!
Try this: Identify a topic that you care deeply about and build a personal project around it that would display your data skills.
- Topic you care about:
- Data skill you want to display:
- Who you will share it with:
__
Conclusion
It’s confusing when you’re trying to pivot into a data career. There’s no one right answer and no shortcut, but I hope my journey can help you jump-start your journey. Here is a checklist to get you started today:
- Assess Your Constraints
- List out two things that your career MUST HAVE:
- List out two things that your career MUST HAVE:
- Connect with Others
-
- Identify three to five people who can be on your virtual “Board of Directors” and note what you admire them for:
- Identify three to five people who can be on your virtual “Board of Directors” and note what you admire them for:
- Create Your Assets
-
- Identify a topic that you care deeply about and build a personal project around it that would display your data skills:
- Topic you care about:
- Data skill you want to display:
- Who will you share it with:
- Identify a topic that you care deeply about and build a personal project around it that would display your data skills:
Think about this checklist as an iterative circle. Keep assessing, connecting, and creating until you’ve found a path that looks promising. You can always jump back into the circle if you need to pivot again.
I hope hearing about my journey has inspired you to confidently take the first step toward your pivot into a data career. Keep at it, and you’ll be sharing your successful pivot story with others in no time!
If there’s anything I can help you with on your journey, please don’t hesitate to connect with me on Twitter or LinkedIn. I’d love to hear from you!


