Home/Tag: comic

October 2023

An Illustrated Guide to Data Literacy: What’s an Interval Scale?

By |2023-10-05T13:53:50-07:00October 5th, 2023|Helpful Explainers|

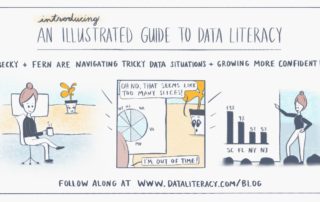
An Illustrated Guide to Data Literacy: What in the World is an Interval Scale? Welcome back to our comic series that explores a range of data literacy concepts. We follow Becky, who describes herself as a bit data-phobic, as she navigates tricky situations at her new job. She'll learn to create effective [...]

Comments Off on An Illustrated Guide to Data Literacy: What’s an Interval Scale?

August 2023

An Illustrated Guide to Data Literacy: Make a Goal Tree

By |2023-11-06T12:38:41-07:00August 10th, 2023|Helpful Explainers|

An Illustrated Guide to Data Literacy: Make a Goal Tree Welcome back to our comic series that explores a range of data literacy concepts. We follow Becky, who describes herself as a bit data-phobic, as she navigates tricky situations at her new job. She'll learn to create effective charts, grasp statistical concepts, [...]

Comments Off on An Illustrated Guide to Data Literacy: Make a Goal Tree

May 2023

An Illustrated Guide to Data Literacy: Use Your Intuition

By |2023-05-11T06:06:41-07:00May 11th, 2023|Helpful Explainers|

An Illustrated Guide to Data Literacy: Use Your Intuition  Welcome back to our comic series that explores a range of data literacy concepts. We follow Becky, who describes herself as a bit data-phobic, as she navigates tricky situations at her new job. She'll learn to create effective charts, grasp statistical concepts, and [...]

Comments Off on An Illustrated Guide to Data Literacy: Use Your Intuition

January 2023

An Illustrated Guide to Data Literacy: Data is Useless on its Own

By |2023-05-11T05:19:50-07:00January 27th, 2023|Helpful Explainers|

An Illustrated Guide to Data Literacy: Data is Useless on its Own  Welcome back to our comic series that explores a range of data literacy concepts. We follow Becky, who describes herself as a bit data-phobic, as she navigates tricky situations at her new job. She'll learn to create effective charts, grasp [...]

Comments Off on An Illustrated Guide to Data Literacy: Data is Useless on its Own

November 2022

An Illustrated Guide to Data Literacy: When Small Changes Make a Big Difference

By |2023-05-11T05:21:09-07:00November 14th, 2022|Helpful Explainers|

An Illustrated Guide to Data Literacy: When Small Changes Make a Big Difference Welcome back to our comic series that explores a range of data literacy concepts. We follow Becky, who describes herself as a bit data-phobic, as she navigates tricky situations at her new job. She'll learn to create effective charts, [...]

Comments Off on An Illustrated Guide to Data Literacy: When Small Changes Make a Big Difference

May 2022

An Illustrated Guide to Data Literacy: Percent Change + Percentage Points

By |2023-05-11T05:21:19-07:00May 2nd, 2022|Helpful Explainers|

An Illustrated Guide to Data Literacy: Percent Change + Percentage Points Welcome back to our comic series that explores a range of data literacy concepts. We follow Becky, who describes herself as a bit data-phobic, as she navigates tricky situations at her new job. She'll learn to create effective charts, grasp statistical [...]

Comments Off on An Illustrated Guide to Data Literacy: Percent Change + Percentage Points

December 2021

An Illustrated Guide to Data Literacy: Base Rate Fallacy

By |2023-05-11T05:21:32-07:00December 7th, 2021|Helpful Explainers|

An Illustrated Guide to Data Literacy: Base Rate Fallacy Welcome back to our comic series that explores a range of data literacy concepts. We follow Becky, who describes herself as a bit data-phobic, as she navigates tricky situations at her new job. She'll learn to create effective charts, grasp statistical concepts, and [...]

Comments Off on An Illustrated Guide to Data Literacy: Base Rate Fallacy

September 2021

An Illustrated Guide to Data Literacy: Bias in Research

By |2023-05-11T05:21:43-07:00September 1st, 2021|Helpful Explainers|

An Illustrated Guide to Data Literacy: Bias in Research Welcome back to our comic series that explores a range of data literacy concepts. We follow Becky, who describes herself as a bit data-phobic, as she navigates tricky situations at her new job. She'll learn to create effective charts, grasp statistical concepts, and [...]

Comments Off on An Illustrated Guide to Data Literacy: Bias in Research

July 2021

An Illustrated Guide to Data Literacy: Pie Charts

By |2021-07-07T09:36:16-07:00July 7th, 2021|Helpful Explainers|

An Illustrated Guide to Data Literacy: Pie Charts Welcome to our new comic series that explores a range of data literacy concepts. We follow Becky, who describes herself as a bit data-phobic, as she navigates tricky situations at her new job. She'll learn to create effective charts, grasp statistical concepts and confidently [...]

Comments Off on An Illustrated Guide to Data Literacy: Pie Charts