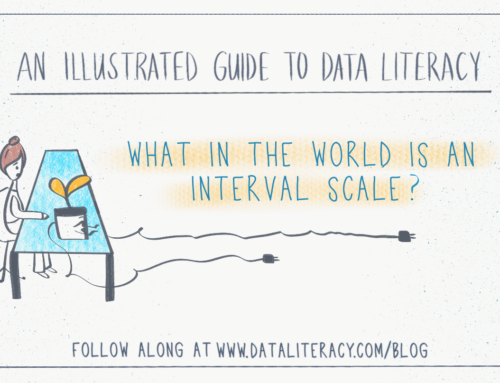
An Illustrated Guide to Data Literacy:
Use Your Intuition
Welcome back to our comic series that explores a range of data literacy concepts. We follow Becky, who describes herself as a bit data-phobic, as she navigates tricky situations at her new job. She’ll learn to create effective charts, grasp statistical concepts, and confidently clean data for analysis with the help of her faithful desk plant Fern.
Today, Becky discovers why intuitive thinking is just as important as analytical thinking!
Catch up on past comic strips: Pie Charts, Bias in Research, Base Rate Fallacy, Percent Change and Percentage Points, When Small Changes Make a Big Difference, Data is Useless on its Own

Dive deeper into this topic with Data Literacy Fundamentals by Ben Jones (e-book PDF or paperback)
If you know anyone who would enjoy following Becky’s journey of becoming a confident data communicator, then please feel free to share this comic series!

Alli Torban is a Senior Data Literacy Advocate at Data Literacy LLC, with more than 15 years of experience solving complex data challenges for government agencies, research institutes, and corporate clients. Alli possesses technical expertise in data communication and a demonstrated talent for combining data and design in an inclusive way, making her a highly effective information designer and trainer. She shares her knowledge on her popular podcast, Data Viz Today, which earned her the Impactful Community Leader award from the Data Visualization Society. When she’s not teaching clients the language of data, Alli enjoys designing tessellations and walking to the library with her daughters.