The Difference Between “Prevalence” and “Incidence” and Why We Care
Have you heard the terms “prevalence” and “incidence” in the news lately? What’s the difference between them and why does it matter?
TL;DR
- Prevalence: Number of people in a population who have a disease or other health outcome at one point in time. [Source]
- Incidence: Number of people in a population who develop a disease or other health outcome over a period of time (i.e. new cases over a period of time). [Source]
- What’s the difference? Prevalence includes all cases, both new and pre-existing, in the population at the specified time, whereas incidence is limited to new cases only. [Source]
- Why do we need these measures? These measures work together to help us understand and plan for the impact of a disease or health outcome in our community. [Source]
Our ability to use and understand data isn’t confined to the four walls of our employer. We need to be familiar with key terms in specific domains, like public health, because it helps us navigate difficult decisions that we will encounter in our personal lives, such as a COVID-19 infection or a chronic disease diagnosis.
Here, we’ll define these terms and show you where you might encounter them.
While “prevalence” and “incidence” may be new terms to us, those advocating for more research on rare diseases are very familiar with them. Since it’s Parkinson’s Awareness Month, I’d like to highlight these terms in the context of work being done in Parkinson’s disease research.
Parkinson’s disease (PD) occurs when brain cells that make dopamine, a chemical that coordinates movement, stop working or die. PD can cause tremor, slowness, stiffness, and walking and balance problems. PD is a lifelong and progressive disease, which means that symptoms slowly worsen over time. [Source]
Data Literacy’s COO Becky Jones and I both have personal experience with a PD diagnosis in the family, and the first thing you want to know when someone you love is diagnosed is: how common is Parkinson’s disease?
Here, we’d be searching for prevalence.
What is “prevalence”?
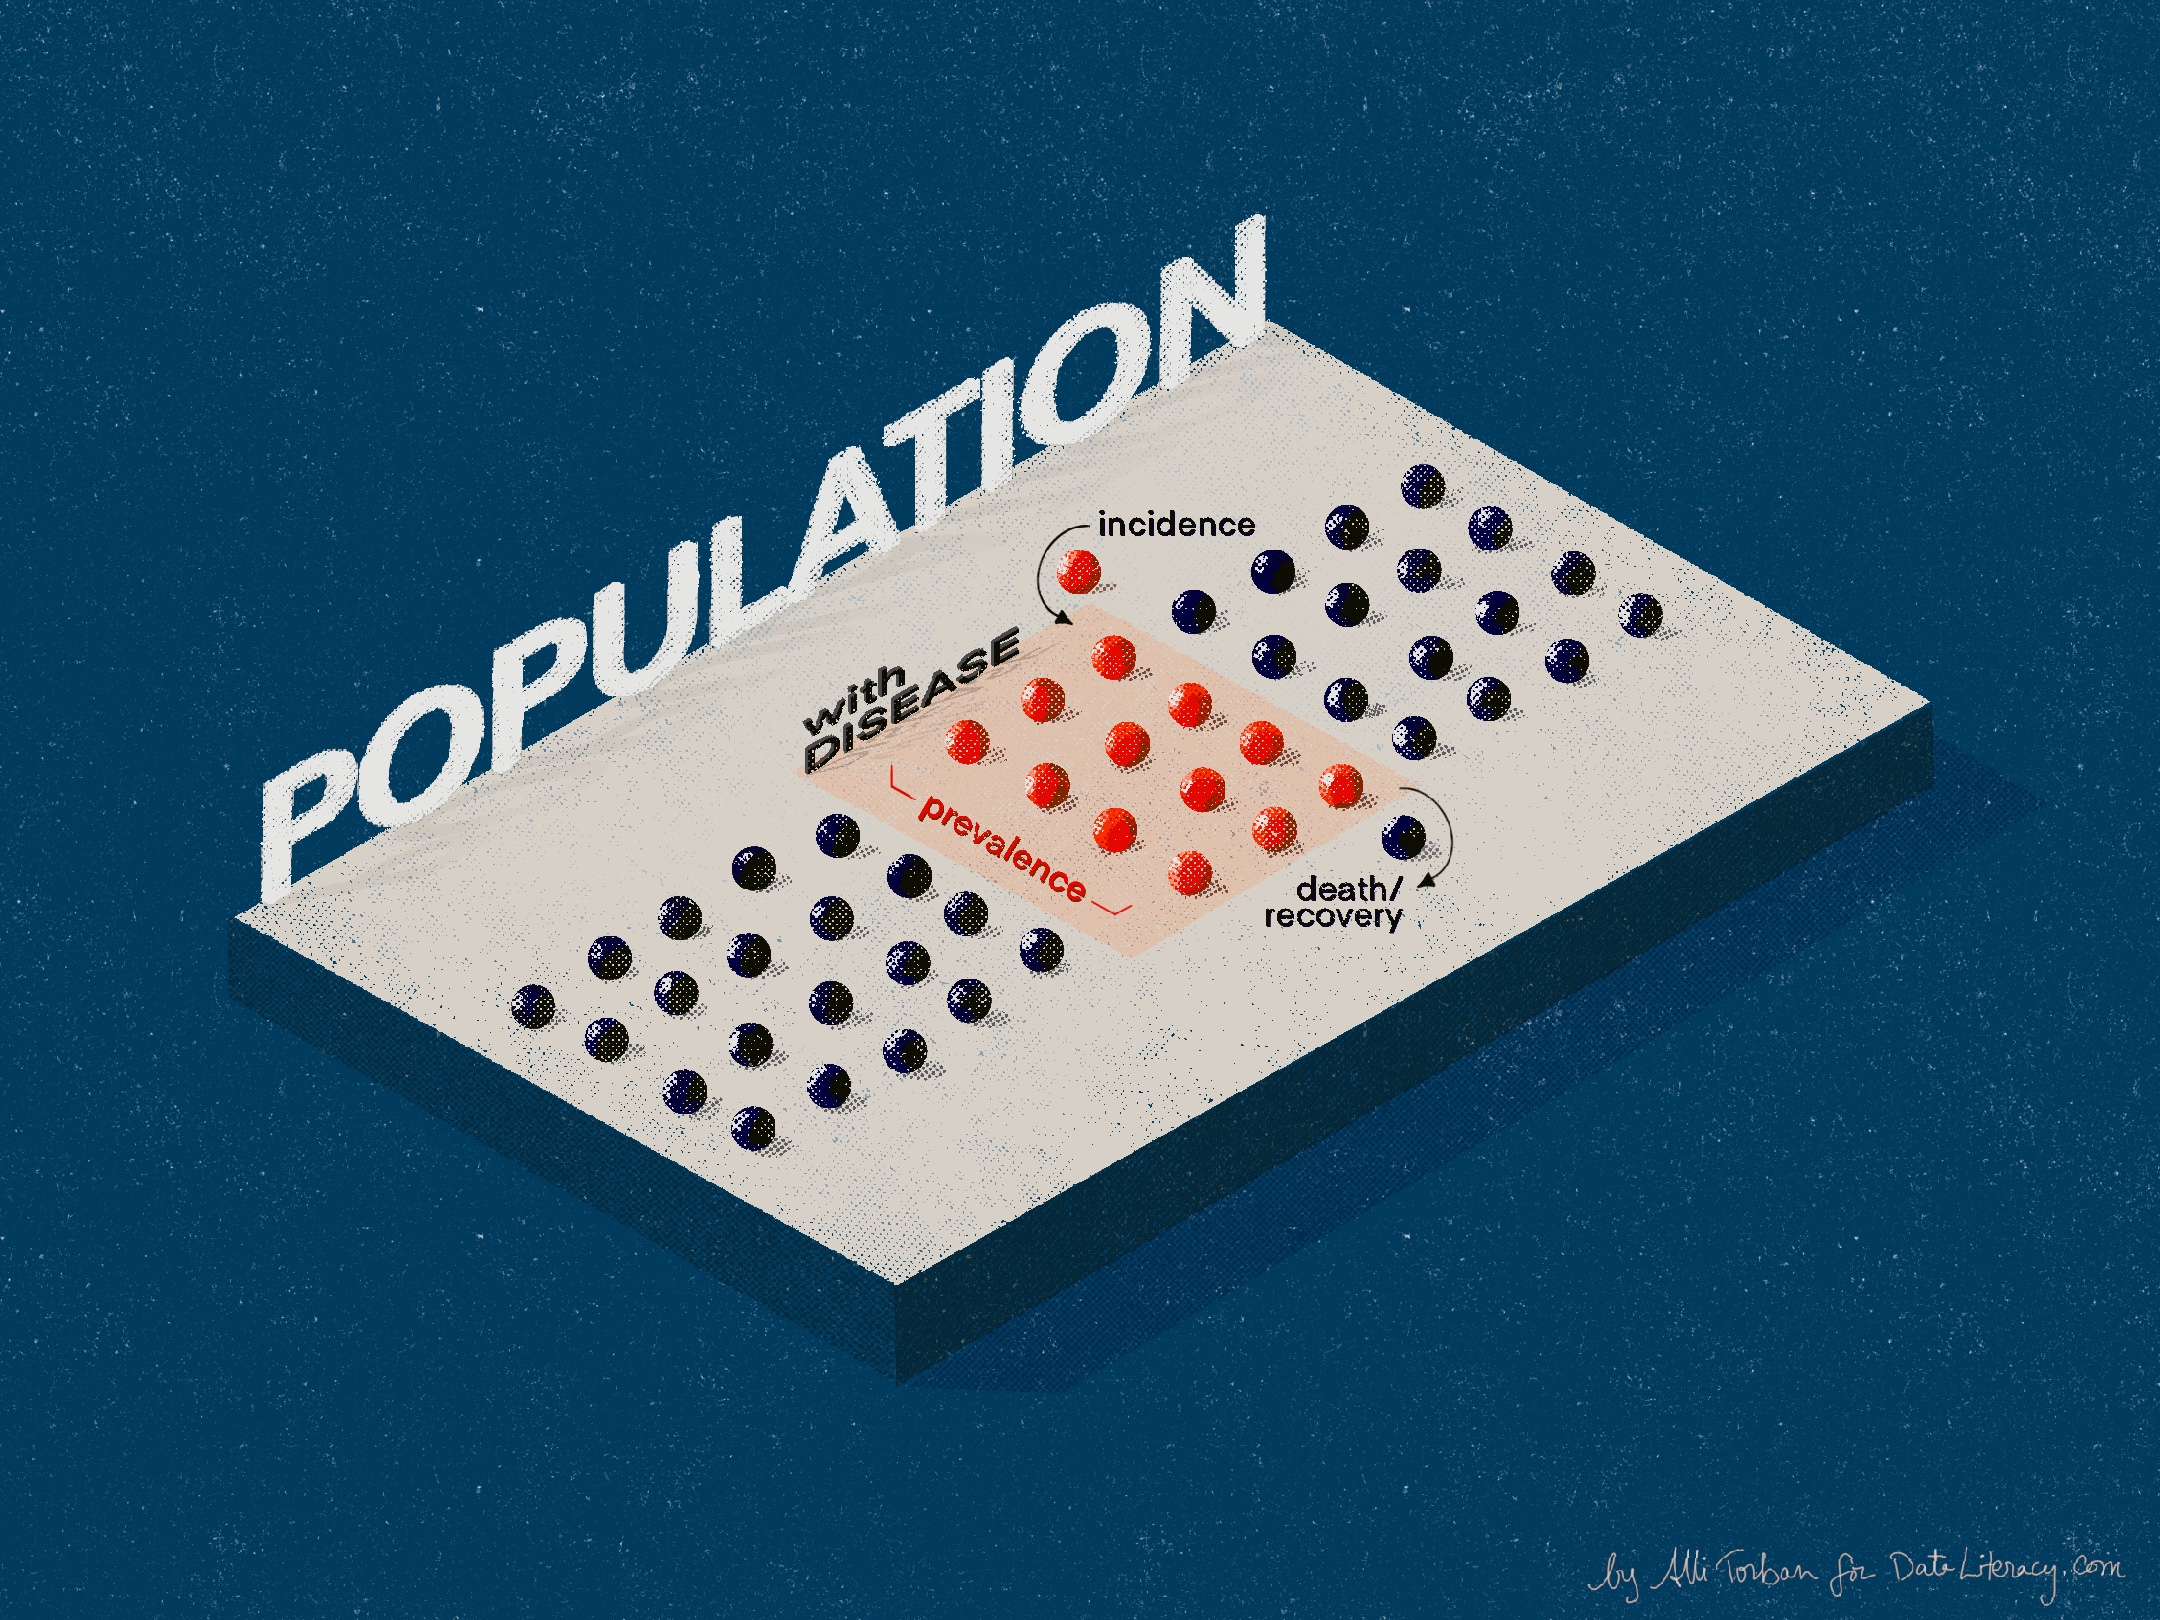
Prevalence: the number of people in a population who have a disease or other health outcome at one point in time. [Source]
“With an estimated 6 million people worldwide currently living with Parkinson’s, and the disease prevalence expected to double by 2040, the need for advancing critical breakthroughs and treatments is pressing,” said Leslie Kirsch, Director of Data Partnerships at The Michael J. Fox Foundation.
Prevalence helps us understand how many people are currently living with this condition, and it also helps researchers find patterns among different groups of people. For example, is Parkinson’s disease more prevalent in a particular geographic region? Is it more prevalent among men or women?
We know from the Parkinson’s Foundation Prevalence Project that men are more likely to have Parkinson’s than women, and the prevalence of people diagnosed with PD varies by geographical region. With this information, researchers can now devote more time to find out how.
Gathering prevalence data is a vital first step to better understanding who develops PD and why. However, PD is hard to diagnose, so prevalence data are often undercounted. This is true for other diseases like COVID-19 where we’d have to test the entire population to get a more accurate assessment of the prevalence of COVID-19 in a certain area. However, we can approximate the number based on representative samples.
Some estimates even put PD prevalence at more than 10 million people. While we’re constantly striving to estimate the prevalence of a disease, a critical factor is how many people are entering and leaving the prevalence group.
People leave a prevalence group by recovering from a disease or through death. People are added to the prevalence group by developing a disease. This is where incidence comes in.
What is “incidence”?
Incidence is the number of people in a population who develop a disease or other health outcome over a period of time (i.e. new cases over a period of time). [Source]
When we track how many new cases are diagnosed over a period of time, we can see if the rate of diagnosis is increasing or decreasing. Being able to study incidence amongst subgroups (such as age, sex, race) provides very helpful information as well.
The Parkinson’s Foundation states: “Incidence of Parkinson’s Disease increases with age.” This means that more new cases are diagnosed in every subsequent age group, so this is a growing problem in our communities.
“The upcoming demographic shifts toward older individuals in western nations have led to major efforts to project the health-care burden over the coming decades, particularly for diseases for which incidence rises considerably with age, such as Alzheimer’s disease and Parkinson’s disease,” says Dr. Marras et al in Prevalence of Parkinson’s disease across North America.
Studying incidence is also important for diseases with unknown causes. Many people don’t realize that there are a handful of rare progressive diseases that are often misdiagnosed as PD in the early stages, which are called Atypical Parkinsonian disorders. One of these disorders is Progressive Supranuclear Palsy (PSP).
“In most cases, PSP is sporadic, meaning there are no known causes. Accurately measuring incidence is critical to study the possible link between PSP and environmental factors or lifestyle changes,” said the Vice President of Scientific Affairs at CurePSP Kristophe Diaz.
Why do we need to study both?
You can see how estimating the risk and burden of a disease on a community can be very complex, but it is vital to study both prevalence and incidence to help get the resources we need.
“When scientists are looking to develop new therapeutics and measure the success of clinical trials to improve the lives of people and families living with Parkinson’s, they think about a cure both in terms of preventing new diagnoses (decreasing incidence) and treating existing diagnoses (decreasing prevalence),” said Kirsch.
We rely on both measures, but you may see prevalence data reported more often for chronic diseases like PD because a person will remain in the prevalence group for a long time until they pass away.
For COVID-19, the time in which a person is in the prevalence group is shorter (typically a matter of weeks), so we tend to hear about the number of new cases each day, which is incidence.
Whether you see one measure reported more than the other, public health professionals still use a combination of prevalence, incidence, and other measures to study the effects of diseases on our community to help us prepare for the future.
Amanda Makulec, the Executive Director of the Data Visualization Society, points out, “As public health professionals, we also look for other factors that could drive the changes in incidence. For example, was there any change in how we diagnose a disease and classify a case? Was a more sensitive test released into the market to detect disease earlier? These nuances are why looking at multiple indicators together is so critical to designing public health interventions.”
Conclusion
In summary, you’ll see “prevalence” to refer to the number of people currently diagnosed with a disease, and you’ll see “incidence” when referring to the new cases being diagnosed over a period of time. We need both measures to help assess the risk and burden of diseases on our community.
Data literacy skills are vital for our professional, public, and personal lives. If you know someone who could benefit from this article, please share!
If you’d like to help move forward Parkinson’s disease research, please consider donating to the Michael J Fox Foundation.
—

Alli Torban is a contributor to Data Literacy LLC. She’s an Information Design Consultant based in Washington, D.C. and hosts the podcast Data Viz Today. Alli specializes in designing data visualizations for industry experts to help get their work seen and understood by a wider audience. She enjoys creating whimsical patterns and spending time with her husband and two daughters.


