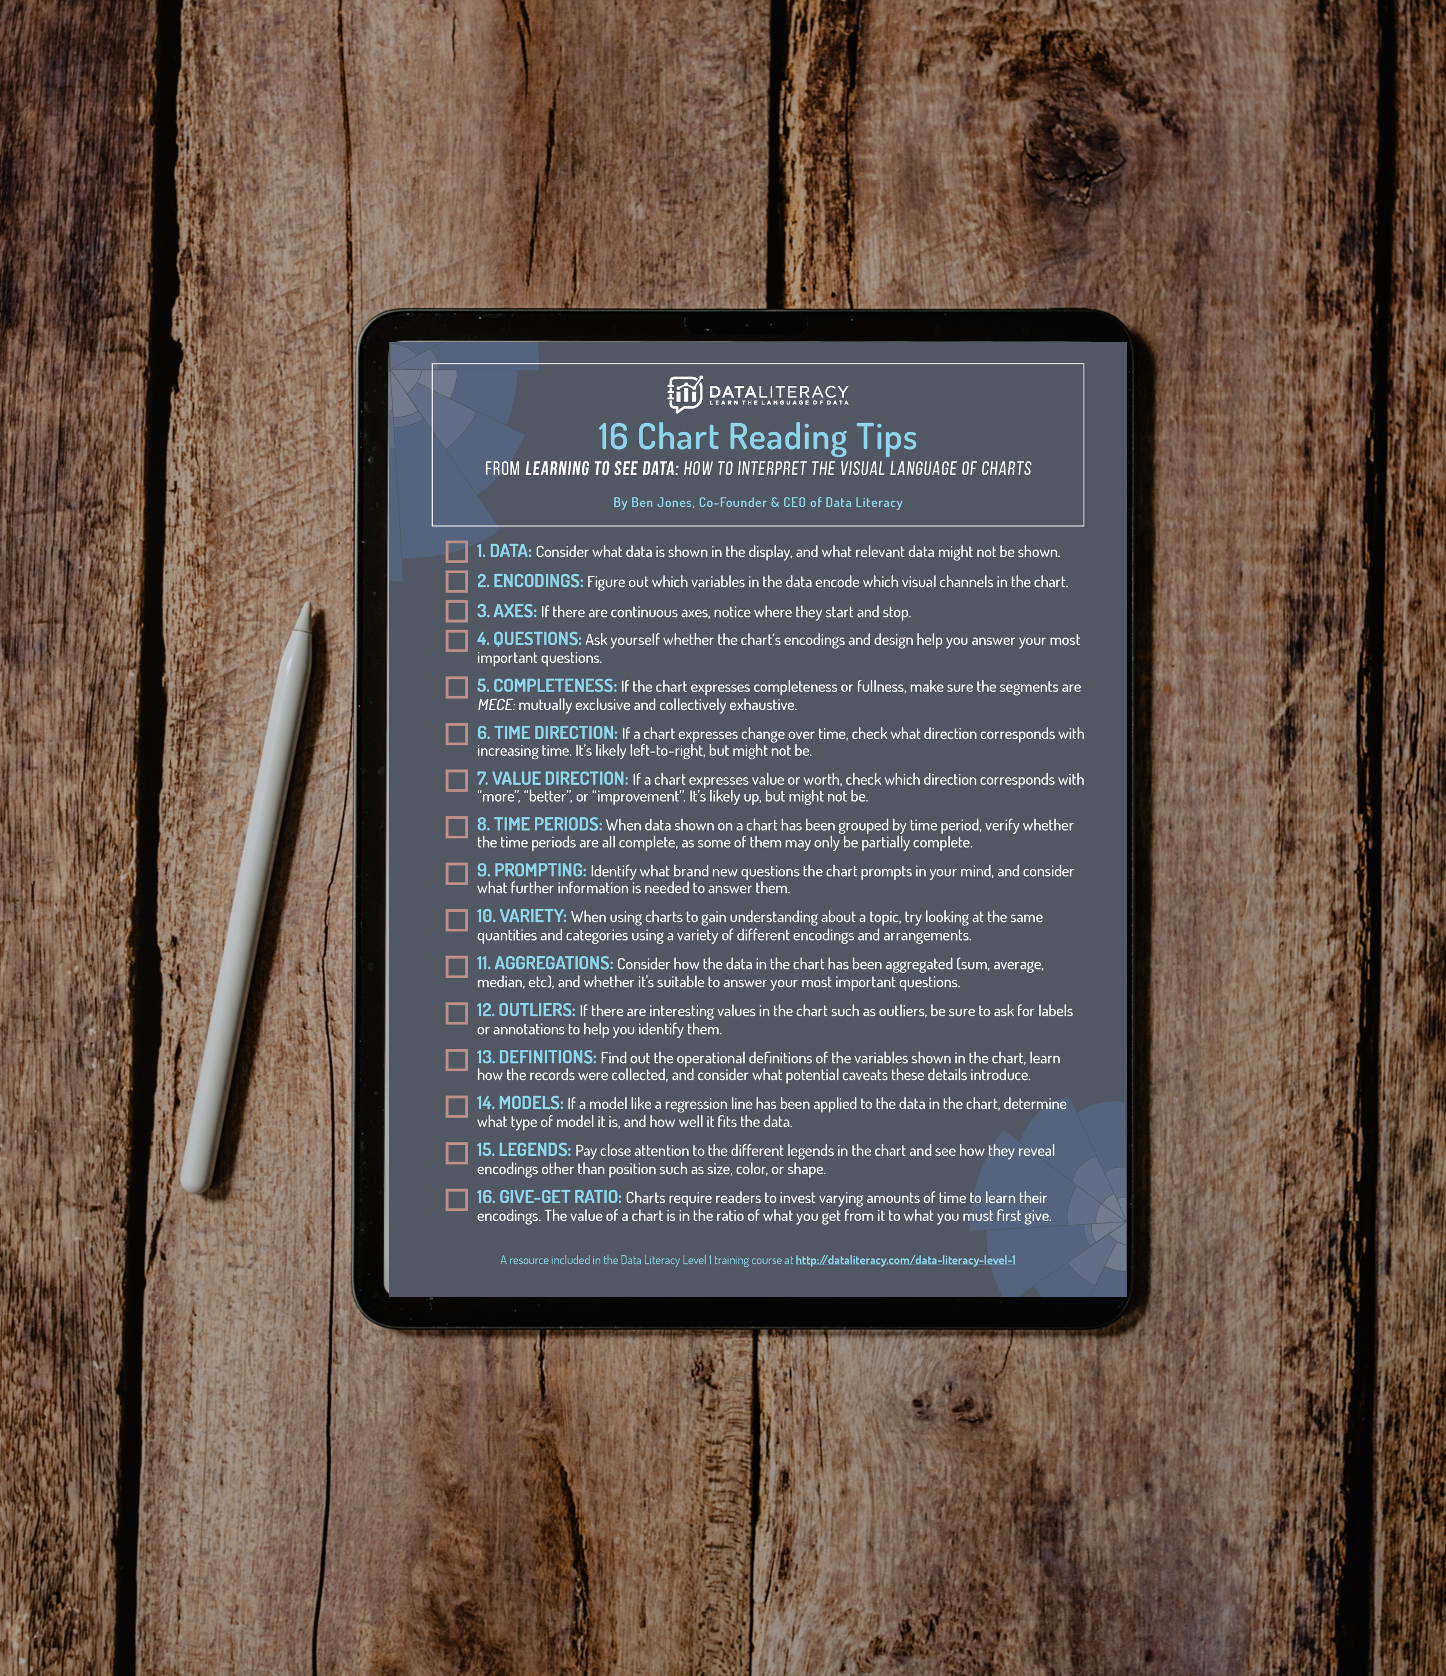
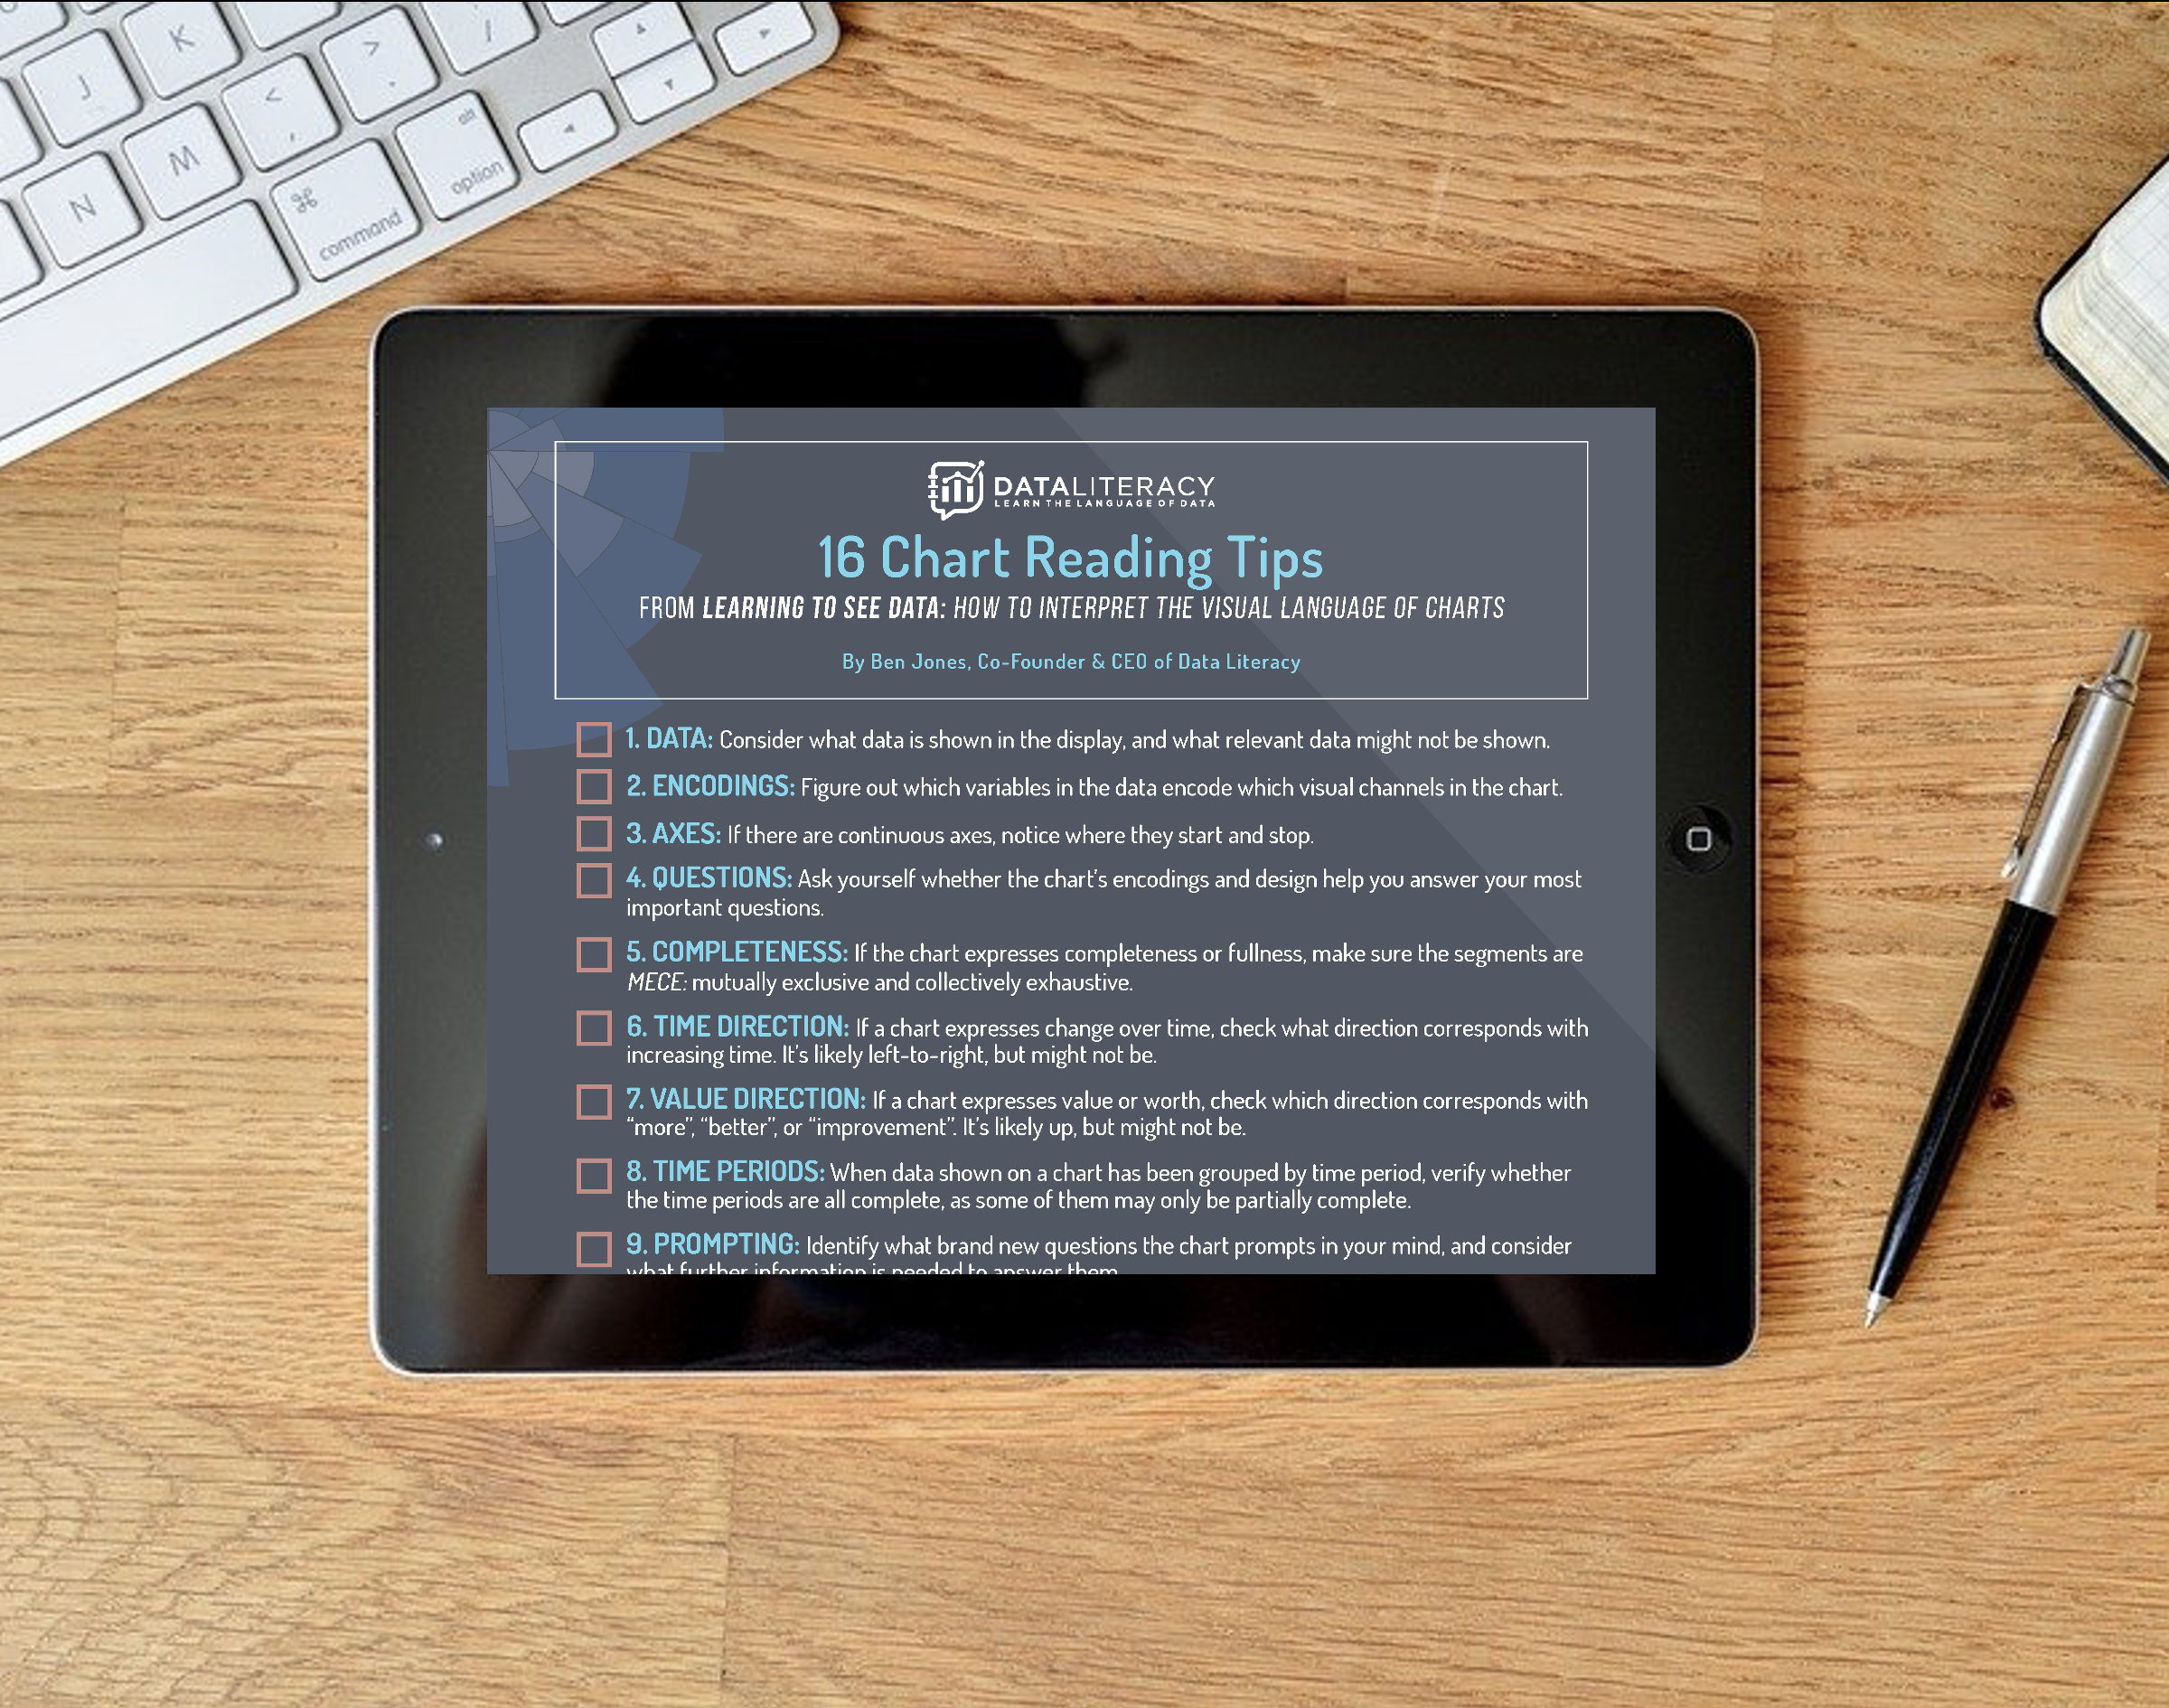
The “16 Chart Reading Tips” Checklist
Have you ever had that experience where you came across a confusing chart and you just didn’t know where to start? This checklist was designed to help people in that exact situation.
It’s derived from the recent Amazon #1 New Release by Data Literacy Press, Learning to See Data, written by Data Literacy co-founder and CEO Ben Jones. This content is also included in our newest On-Demand course, Data Literacy Level 1, which has helped thousands of people become more fluent in the visual language of data since it was launched in December 2020.
Just like the guide to the book “Avoiding Data Pitfalls” (Wiley, 2019), the layout and graphic design of this checklist was created by the talented Kelsey O’Donnell, and takes inspiration from the work of data visualization design hero Florence Nightingale. It provides a helpful list of elements and factors to find and consider as you seek to interpret a chart’s meaning. Feel free to let us know what you think by tweeting us @DataLiteracyCom or by emailing us at contact@dataliteracy.com.
To get a copy of the checklist sent to your inbox, fill out the form below, and see our Privacy Policy if you have any concerns about how we will and won’t use your personal information. All the best on your chart-reading endeavors!
