Home/2021

March 2021

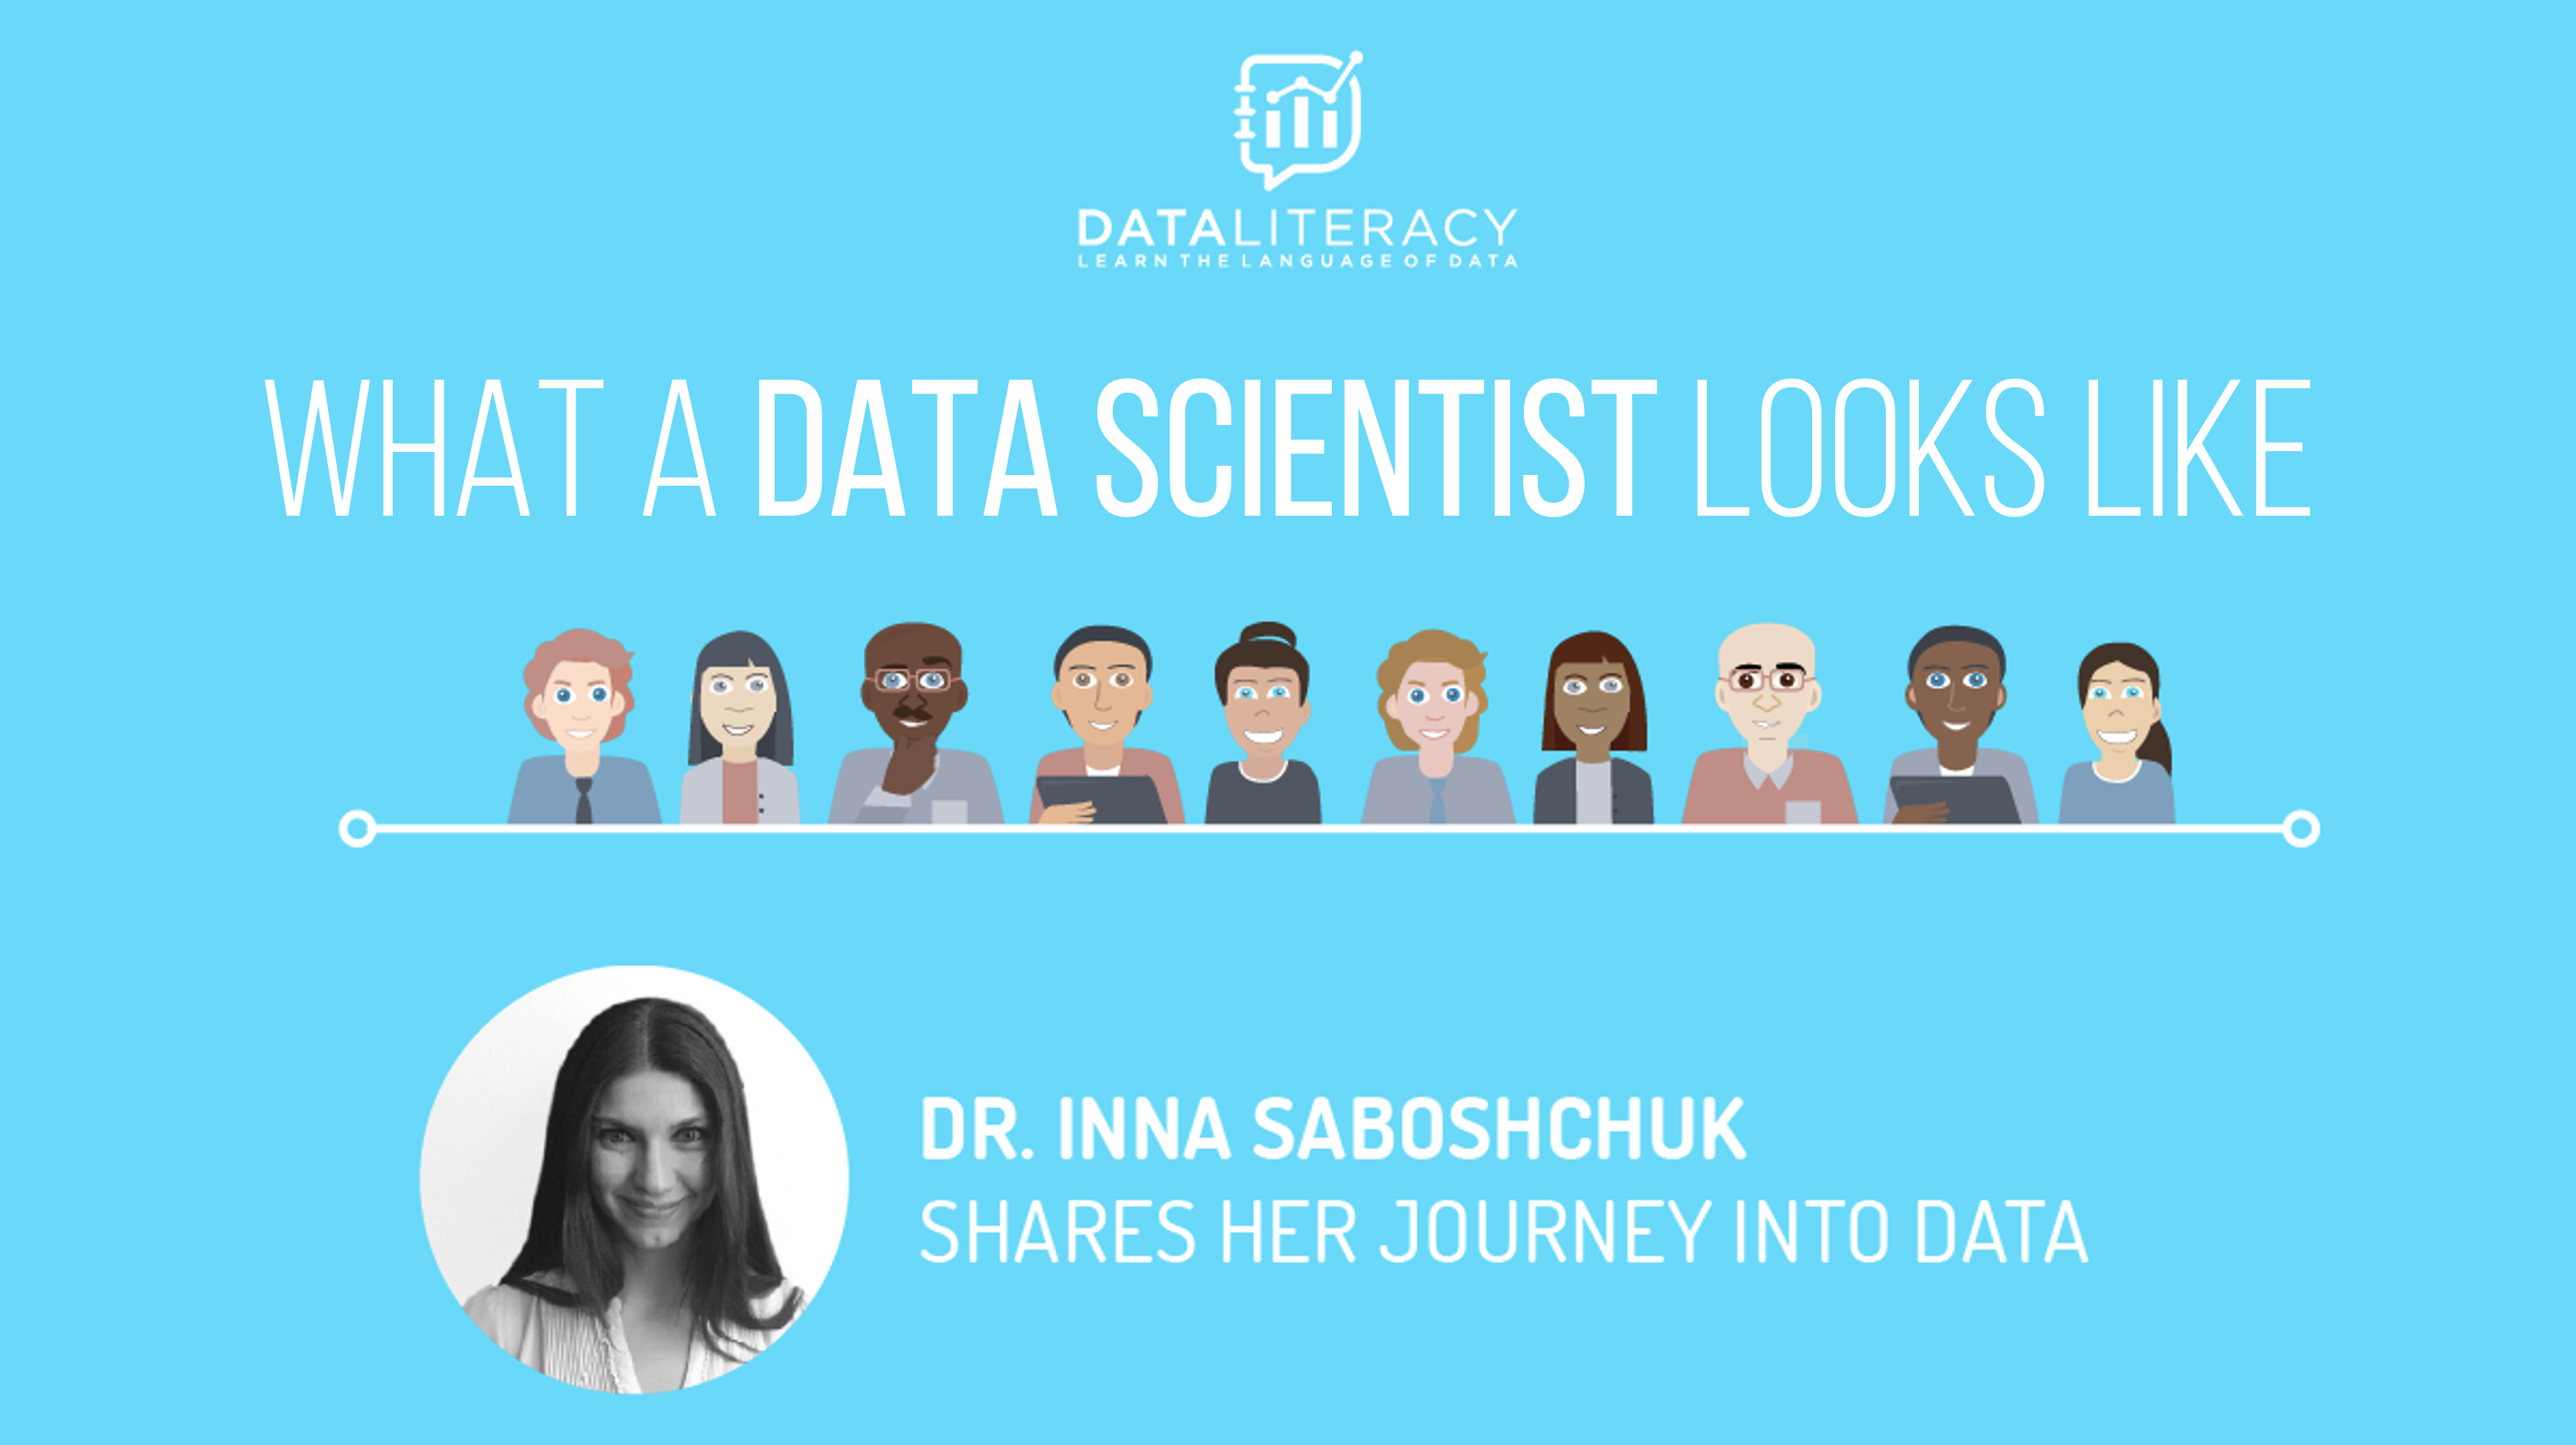
What a Data Scientist Looks Like

By |2021-03-08T16:25:35-07:00March 8th, 2021|Personal Stories, Social Justice|

The following International Women's Day guest blog post was written by Inna Saboshchuk, PhD. Inna is a senior data product manager in the retail industry in NYC.  She previously worked as a data scientist for a SaaS company which uses AI to automate and optimize retail processes. Additionally she taught psychology courses at [...]

February 2021

Anthony Starks on Recreating Du Bois’s Iconic Style

By |2021-02-25T20:21:18-07:00February 25th, 2021|Contests, Social Justice|

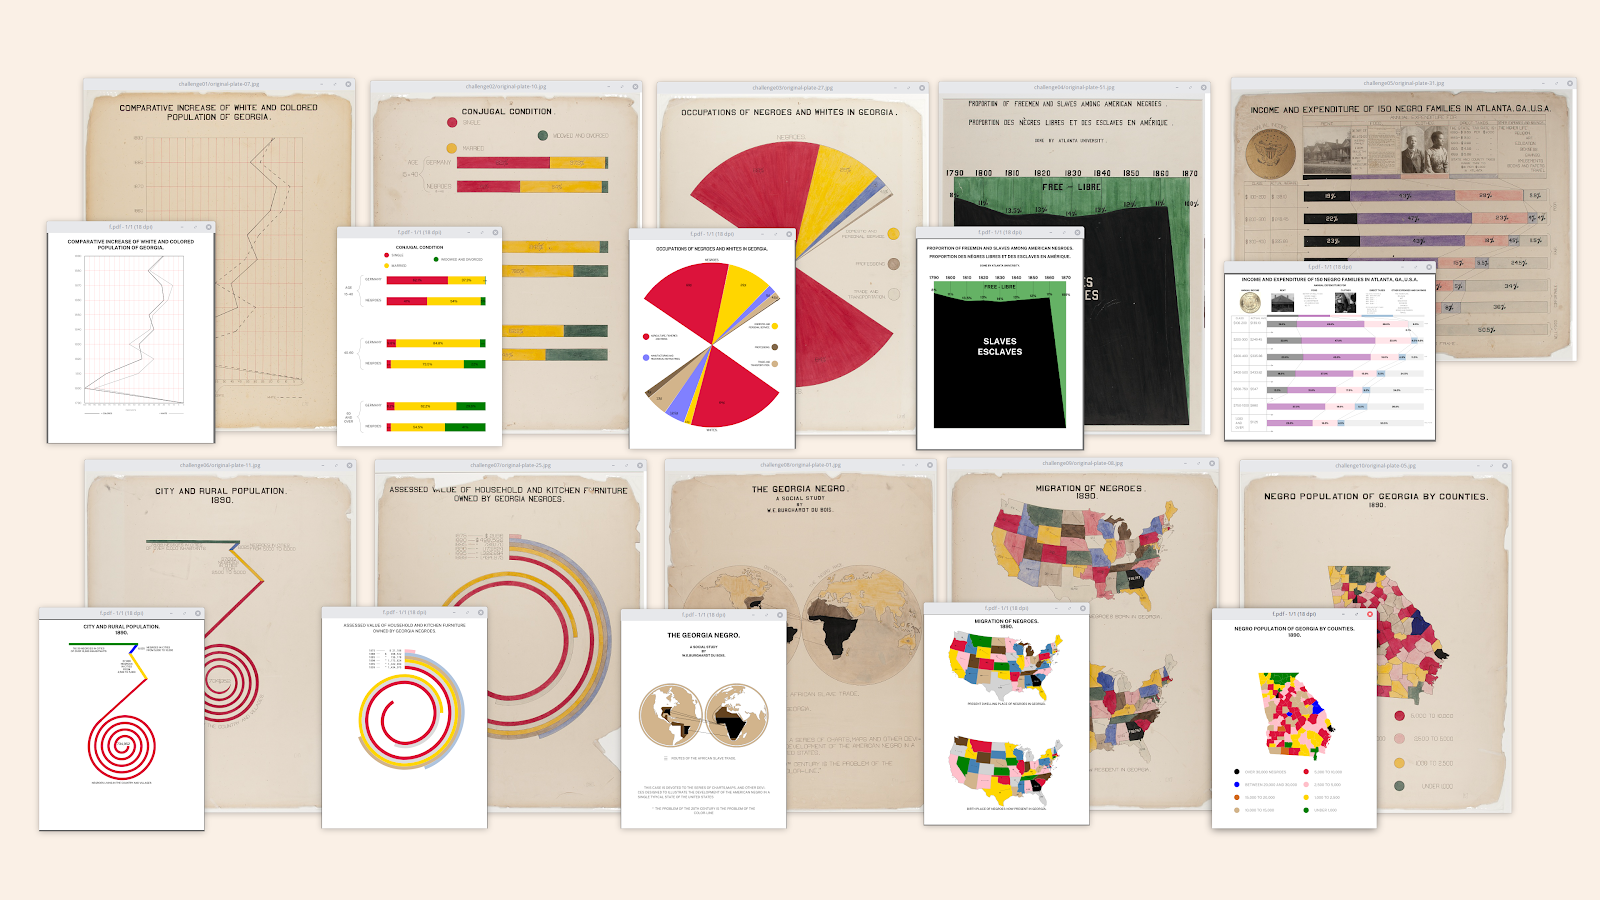
Anthony Starks on Recreating Du Bois’s Iconic Style By Allen Hillery Allen would like to acknowledge Anthony Starks for his expert assistance with this article. Earlier this month, Sekou Tyler, Anthony Starks and I thought it was important to recognize the accomplishments of W.E.B. Du Bois. Du Bois’ sophisticated quantitative research leveraging data visualization, [...]

Be Data Lit: Creating Communities that Matter

By |2021-02-03T18:35:29-07:00February 3rd, 2021|Announcements|

This guest blog post has been written by Sarah Nell-Rodriguez, a globally recognized industry expert in software education and Data Literacy, and founder of the recently launched Be Data Lit online community site. Sarah would like to acknowledge Allen Hillery for his expert assistance with this article. The header image above with the tagline [...]

How W.E.B Du Bois Used Data Visualization to Debunk Social Darwinism and Tell A Story of Resilience

By |2021-02-01T19:58:06-07:00February 1st, 2021|Uncategorized|

How W.E.B Du Bois Used Data Visualization to Debunk Social Darwinism and Tell A Story of Resilience Editor's note: A version of the following article by Allen Hillery also appears on the Nightingale blog of the Data Visualization Society here. For other articles written by Mr. Hillery, see his Medium page. William Edward Burghardt Du [...]

January 2021

Jon Schwabish’s “One Chart at a Time” Series

By |2021-01-14T16:16:03-07:00January 14th, 2021|Uncategorized|

Jon Schwabish's "One Chart at a Time" Series Jon Schwabish, host of the Policy Viz podcast and author of Better Presentations as well as the forthcoming Better Data Visualizations, has started 2021 with a video series called "One Chart at a Time". In this series, Jon is inviting guest speakers [...]

Load More Posts