Home/Ben Jones

About Ben Jones

Ben Jones is the founder and CEO of Data Literacy, LLC, a training and education company that's on a mission to help people learn the language of data. Ben also teaches data visualization at the University of Washington, he's the author of Avoiding Data Pitfalls (Wiley, 2019) and Communicating Data With Tableau (O'Reilly 2014) and he writes about data topics at his blog DataRemixed.com.

September 2019

Announcing the Data Literacy Fall 2019 Line Up!

By |2019-09-11T01:22:23-07:00September 10th, 2019|Announcements|

Registration is Now Open for Two New Online Courses in Data Literacy! Click the images below to learn more about each new cohort. Register now, as space is limited! If you need financial assistance, please contact us at contact@dataliteracy.com. Data Literacy Level 1 - How to Read and Interpret Data Visualizations - will [...]

July 2019

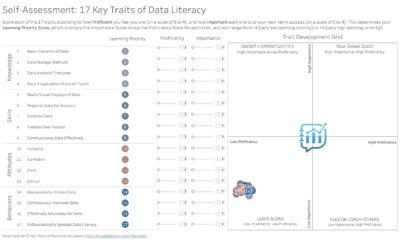
Take the 17 Key Traits Self-Assessment!

By |2021-09-10T13:26:34-07:00July 2nd, 2019|Resources|

Take the 17 Key Traits of Data Literacy Self-Assessment Earlier this year we launched the 17 Key Traits of Data Literacy ebook (now available to download and read on your favorite Kindle device!). Organizations and individuals using this resource have been asking for a way to figure out which of these traits they [...]

April 2019

Announcing 2 New Online Data Literacy Courses!

By |2019-04-23T23:16:39-07:00April 23rd, 2019|Announcements|

Registration is Now Open for Two New Online Courses in Data Literacy! Click the images below to learn more about each new cohort. Register now, as space is limited! If you need financial assistance, please contact us at contact@dataliteracy.com. Data Literacy Level 1 - How to Read and Interpret Data Visualizations - will [...]
Whiteboard Series #001: Four Data Scale Types

By |2019-04-11T22:42:00-07:00April 11th, 2019|Whiteboard|

It's a year of firsts for DataLiteracy.com, and today is yet another - we just published our first whiteboard video! It's all about four different data scale types: Nominal, Ordinal, Interval & Ratio, and since the first letter of each of those types spells "NOIR", what better way to explain them than with red wine?! [...]

March 2019

Website Launch Celebration a Success!

By |2019-03-22T22:44:32-07:00March 22nd, 2019|Uncategorized|

Yesterday afternoon we celebrated the launch of our new website, DataLiteracy.com with a fun happy hour toast and presentation at our headquarters in the Industrious Bellevue office space. Attendees were treated to cocktails from Maker's Mark, appetizers from Purple Cafe, and all received an exclusive 25% off coupon code for upcoming Level 1 and Level [...]

Free Data Practices Courseware Now Available

By |2019-03-21T21:40:15-07:00March 21st, 2019|Resources|

In case you missed the announcement by the Linux Foundation yesterday, a team led by Patrick McGarry and others at data.world has made freely available a set of course materials designed for anyone looking to increase their skills working with data. The materials can be found at datapractices.org/courseware. Why is this announcement so significant? This [...]

Hello, World! Announcing the Launch of DataLiteracy.com

By |2019-03-05T00:04:10-07:00March 5th, 2019|Announcements|

Announcing the launch of the DataLiteracy.com! We're excited to announce that the DataLiteracy.com website is now live! Huge thanks to Mike Sayenko and the whole crew at Sayenko Design for the amazing help designing and building this site. Also, kudos and sincere thanks go out to Michael Varouhas for the fun animated explainer video on [...]

December 2018

Load More Posts