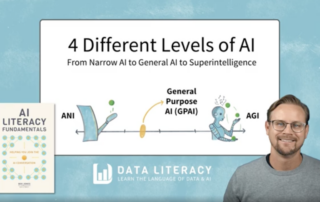
Breaking Down the 4 Different Levels of AI: From Narrow AI to General AI to Superintelligence
Breaking Down the 4 Different Levels of AI: From Narrow AI to General AI to Superintelligence When someone mentions AI, what exactly are they referring to? There are four primary levels of AI and understanding the difference between them is crucial to ensuring we're all on the same page as we engage [...]