Home/Helpful Explainers

September 2021

An Illustrated Guide to Data Literacy: Bias in Research

By |2023-05-11T05:21:43-07:00September 1st, 2021|Helpful Explainers|

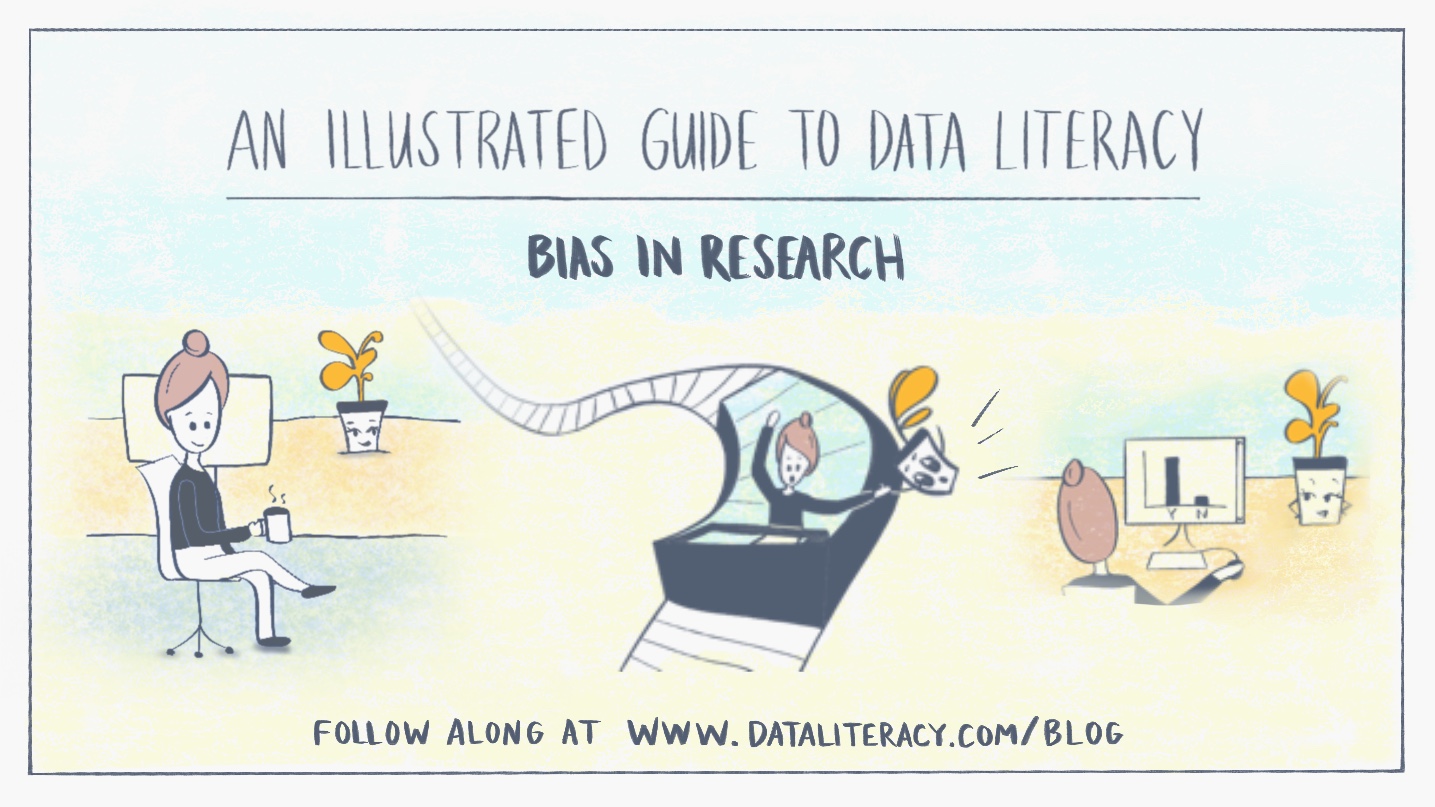
An Illustrated Guide to Data Literacy: Bias in Research Welcome back to our comic series that explores a range of data literacy concepts. We follow Becky, who describes herself as a bit data-phobic, as she navigates tricky situations at her new job. She'll learn to create effective charts, grasp statistical concepts, and [...]

Comments Off on An Illustrated Guide to Data Literacy: Bias in Research

July 2021

An Illustrated Guide to Data Literacy: Pie Charts

By |2021-07-07T09:36:16-07:00July 7th, 2021|Helpful Explainers|

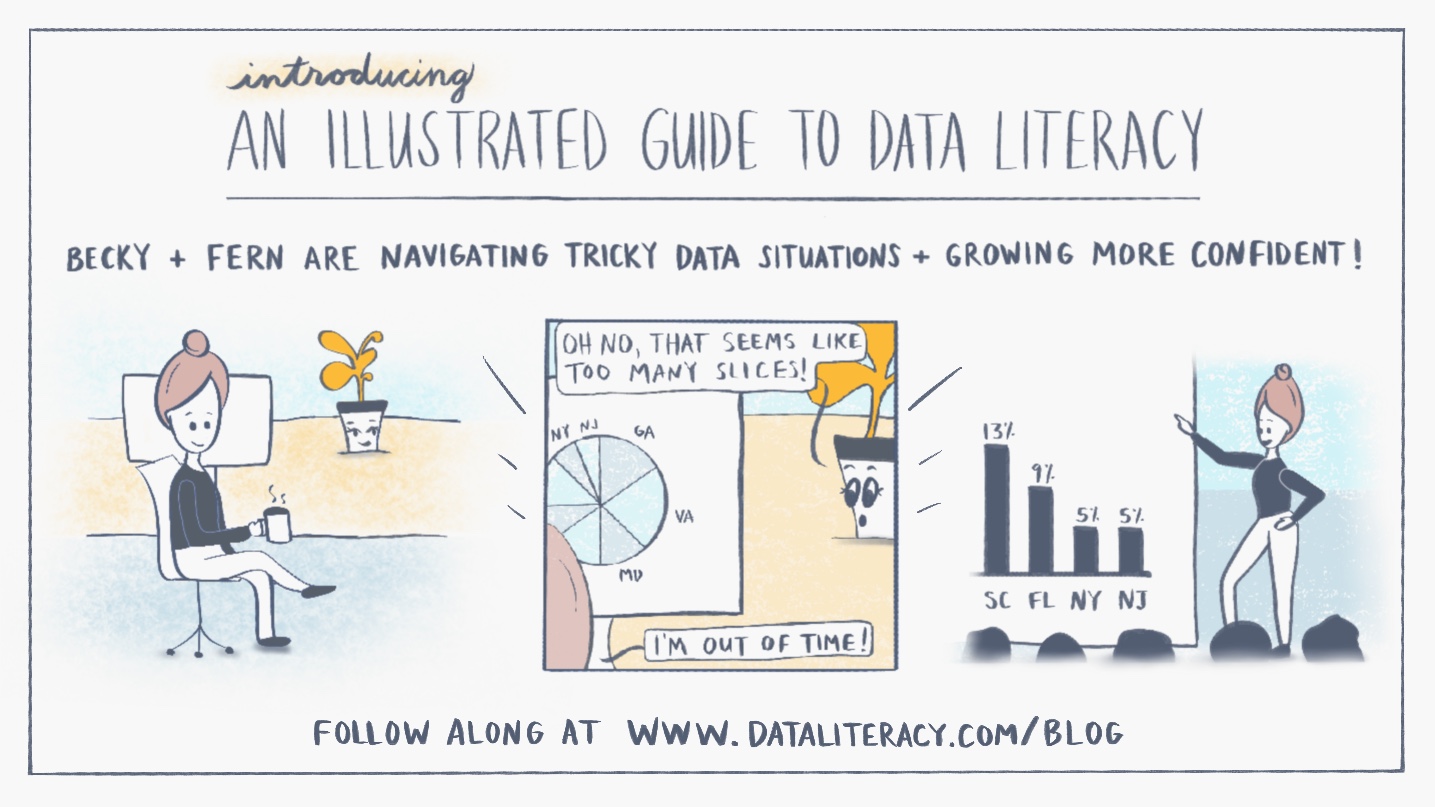
An Illustrated Guide to Data Literacy: Pie Charts Welcome to our new comic series that explores a range of data literacy concepts. We follow Becky, who describes herself as a bit data-phobic, as she navigates tricky situations at her new job. She'll learn to create effective charts, grasp statistical concepts and confidently [...]

Comments Off on An Illustrated Guide to Data Literacy: Pie Charts

May 2021

April 2021

The Difference Between “Prevalence” and “Incidence” and Why We Care

By |2022-08-22T12:11:24-07:00April 27th, 2021|Helpful Explainers|

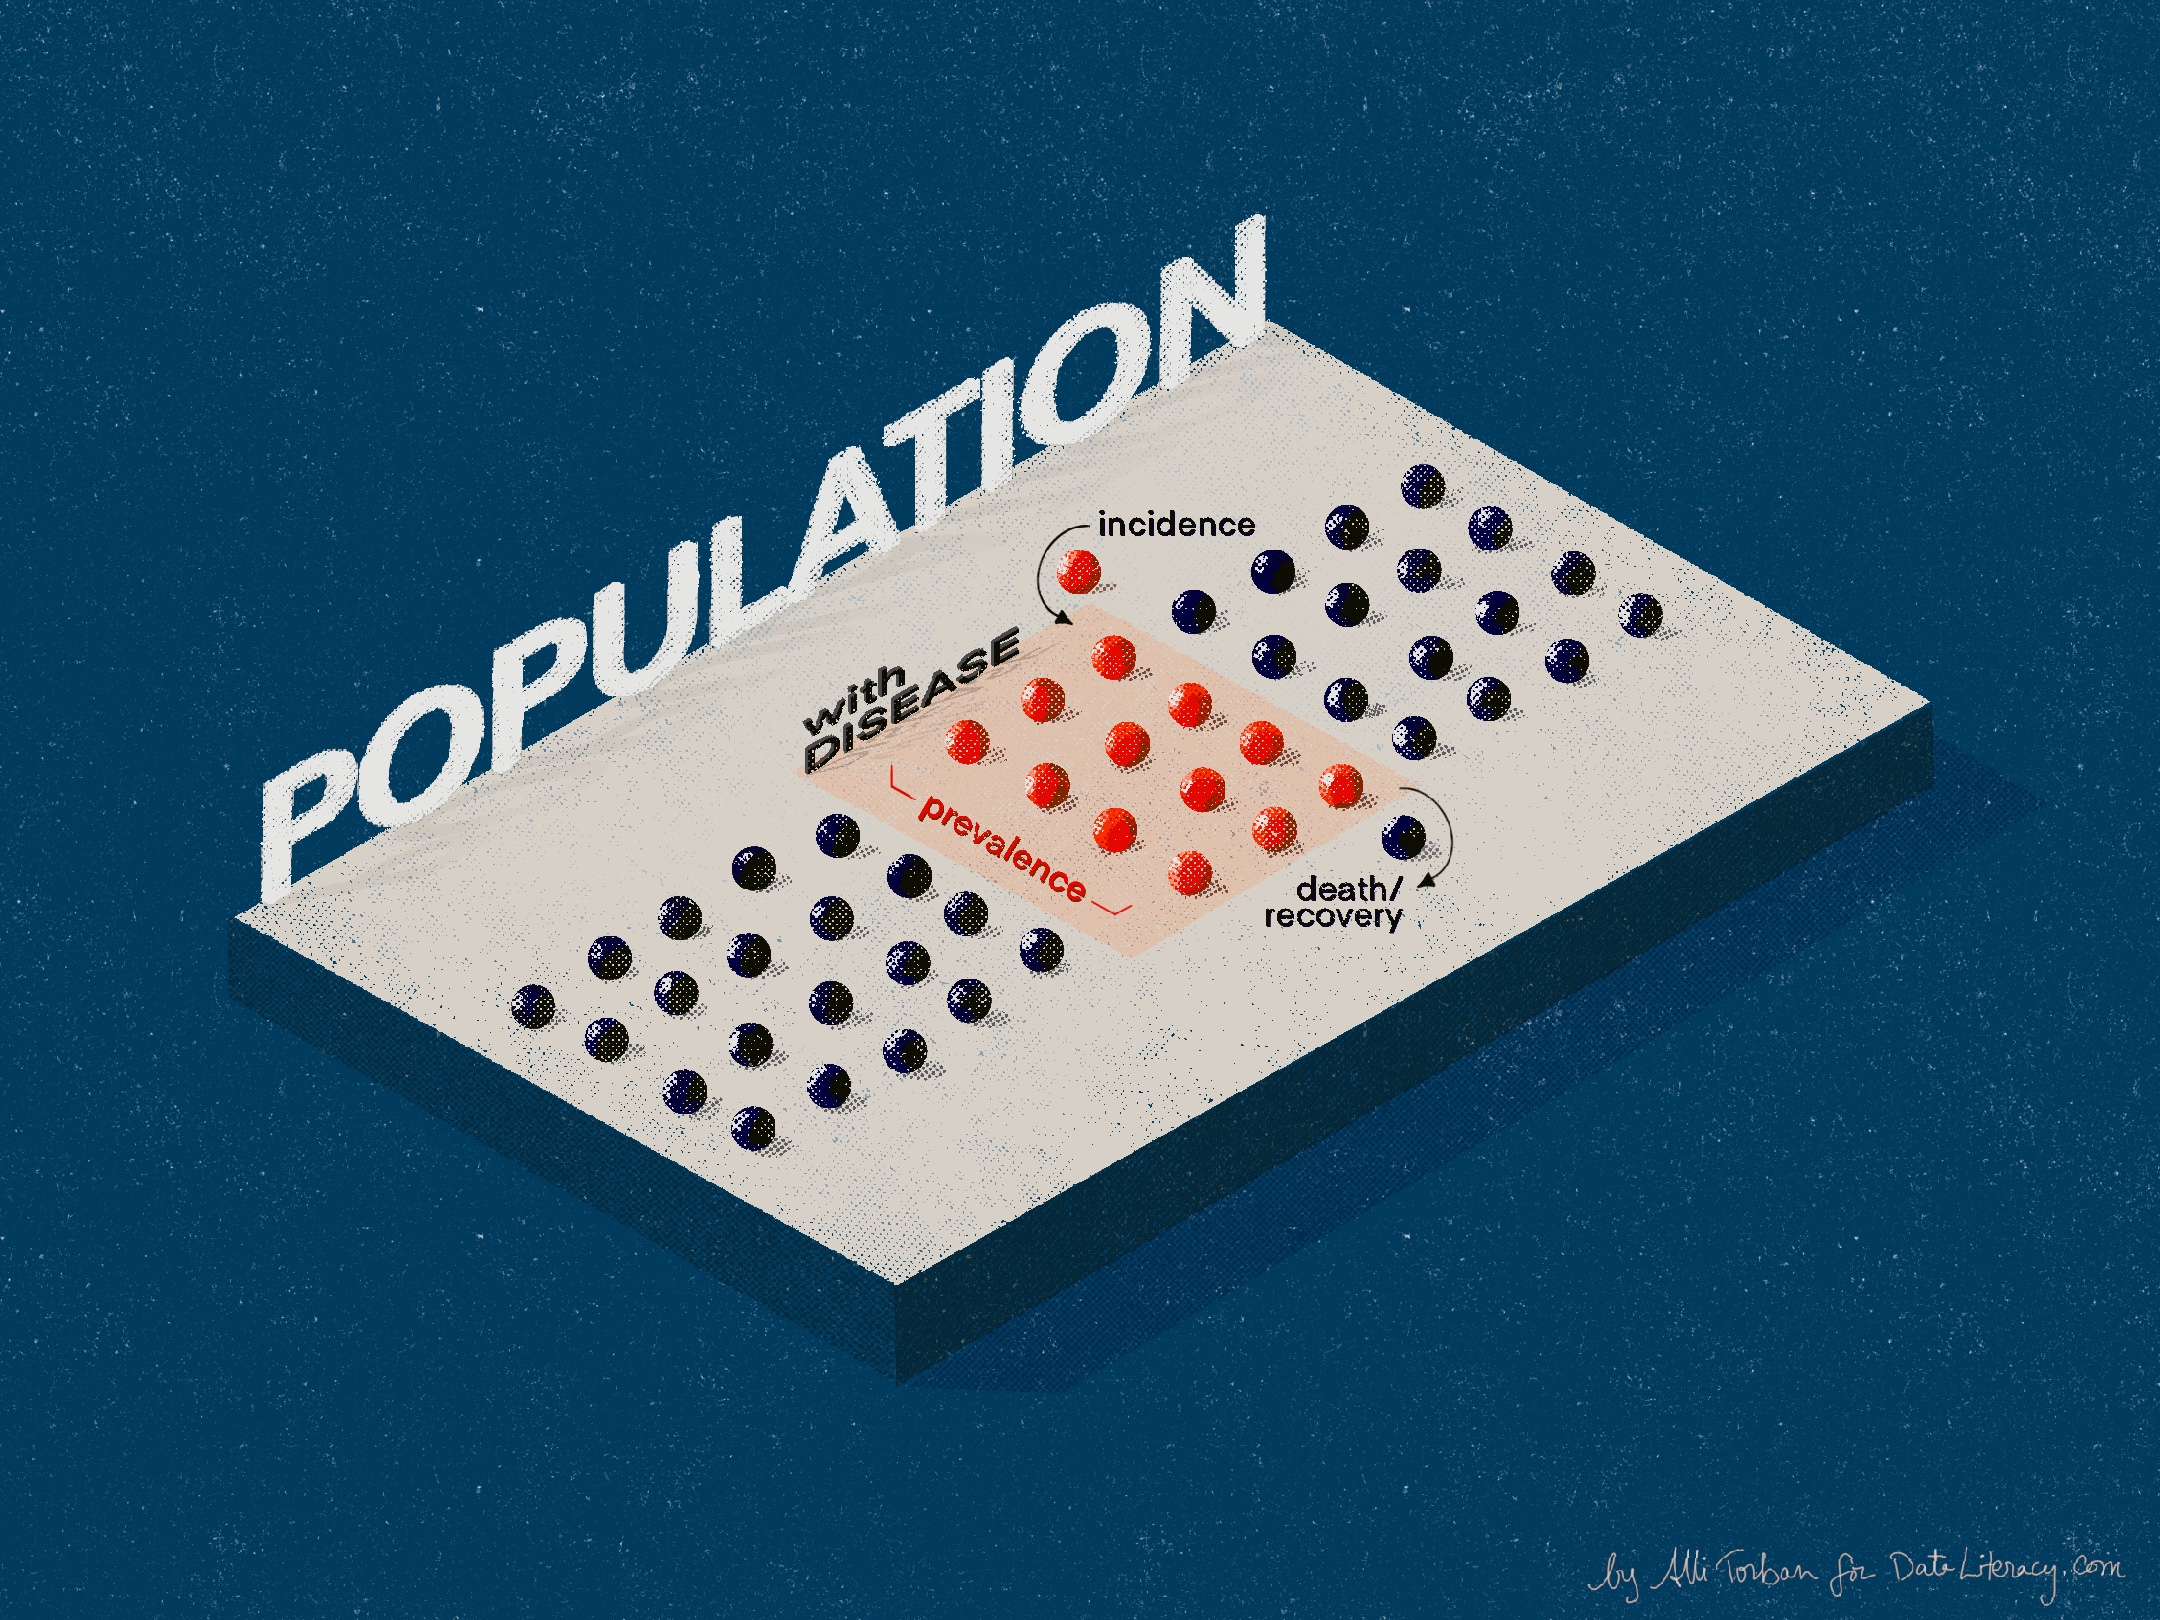
Like what you're reading? Learn all this and more in our on-demand course Data Literacy Fundamentals or purchase its companion book in PDF form. The Difference Between “Prevalence” and “Incidence” and Why We Care Have you heard the terms “prevalence” and “incidence” in the news lately? What’s the difference between them and [...]

March 2021

Load More Posts