Introducing Our Newest Team Member, Alli Torban!
Today I have the honor and pleasure of announcing that we have just hired award-winning Information Designer Alli Torban! Alli joins our team as our Sr. Data Literacy Advocate. In that role, she’ll be responsible for creating engaging instructional content, leading public and private training sessions, and coming up with new ways to raise the bar of data literacy around the world.
Welcome, Alli! We’re so lucky to have someone as creative and brilliant as you on our team!

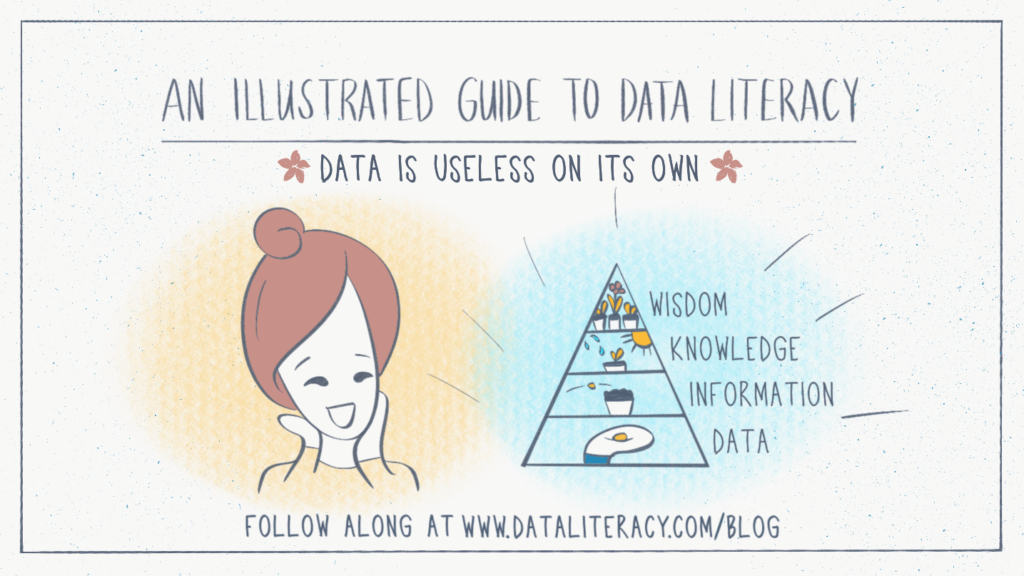
For those of you who have been following us for the past year, you know that Alli has been creating some of the most creative and engaging content for our blog for some time now. She created some of the most widely read articles on our site, her how-to tutorials have helped many people learn the ropes, and her comic series featuring the lovable Becky and Fern (soon to be a fully fledged comic book!) was nominated for an Information is Beautiful award this past year.
But that’s just a fraction of what she has accomplished recently. On top of all of those amazing contributions to our own mission, she also launched the Elevate Dataviz Learning Community, she created bespoke visualizations for her own clients, she made progress on a book of her own, and she won the Impactful Community Leader award in the 2022 Information is Beautiful Awards.
Oh, did I mention that she hosts the monthly podcast Data Viz Today and publishes the weekly newsletter, The Data Creative? And these are just her professional endeavors, by the way. Truly remarkable.
How did this prolific journey begin, you might ask? Well, if you want to know how she pivoted into a data career in the first place, you can read all about her journey, and her thoughts about how it can help you start yours.
To give you a chance to get to know Alli a little better, we asked her to answer some questions for us. Enjoy!
Q: Tell us a little bit about yourself. What’s your background, where are you from, what are some things you love to do, and anything else you’d like to share?
A: Wow, I’m so excited to join the team! I’m a Navy brat who’s made a home in northern Virginia, just outside Washington, D.C. I have a degree in math and spent most of my career working as a systems analyst for government clients. After becoming a mom to two incredible daughters, I decided to embrace my creative side and discovered a passion for data visualization! I’m entirely community-taught, learning from those in the field who generously share their knowledge through my podcast, Data Viz Today. I’m always looking to pay it forward by sharing all the cool things I learn, too. Top hobbies: creating tessellations and whipping up a new sewing project. Maybe someday I’ll combine the two!
Q: Why did you decide to join the Data Literacy team? What about the Data Literacy mission to “help people speak the language of data” resonates with you?
A: Growing up in a quick-witted family, I often felt like the slow thinker in the room. It took me some time to realize that intelligence comes in many forms, but now I have this unshakable sensitivity to making sure people don’t feel left out when learning something new. That’s why when I started collaborating with the Data Literacy team two years ago, I immediately connected with their philosophy of widening the circle of people who can speak the language of data. By joining forces, I know we can make a real impact in the world of data literacy by creating a welcoming space for everyone to learn and grow.
Q: You have created many delightful data visualizations over the past few years. Show us one of your favorites, and tell us why you like it so much.
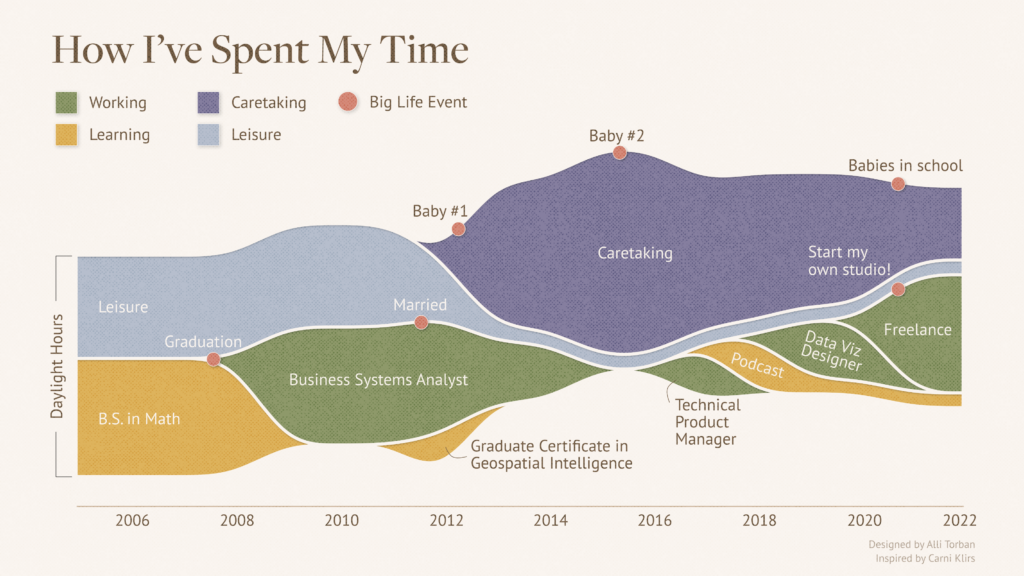
A: My all-time favorite is this stream graph of how I’ve spent my time since college! I was inspired by Carni Klirs’ visual representation, and I wanted to show the unique career path that many people, especially women, navigate when they have kids. Often priorities shift, but nothing is forever. I really valued the connection I felt with other people who lamented, “Wow, I’m swimming in that deep, purple lake of caregiving right now!” Now it needs an update to add Senior Data Literacy Advocate! 🙂
Q: First, HUGE Congrats on winning the Impactful Community Leader award in the 2022 Information is Beautiful Awards. Tell us what that recognition means to you, and how you plan to build on that momentum in 2023 and beyond. For the benefit of our readers, I’ll share this quote that one of her nominators said about her: Alli is a “living example of somebody who has the power to inspire other people and make them feel confident in their own possibilities in the field.”
A: It’d be fun to say, “Well, of course, I deserved it!” but the truth is, I know too many generous and talented people in the field to be that naive! However, I do feel validated that I’m making the impact that I’ve been striving to make — to lift up and support as many people as I can. Winning! Looking ahead to 2023 and beyond, my goal is to expand the data community’s perspective on their creativity. Even though it’s not talked about often, data people are creative and I want to empower them to create a fulfilling creative practice!
Q: I’d like to ask you about a value of yours that we share with you: amplifying marginalized and underheard voices in the data world. Tell us a few things that you think people can do to bring positive change and new voices into the community.
A: While it’s true that those with louder voices should listen more, I also think it’s important to focus on the other side of the coin — helping to cultivate confidence in those who have been underheard. A great way to do this is by developing a safe community to share experiences and provide mentorship. For example, in Elevate, the dataviz learning community that I co-founded, we ran a 4-week challenge where we coached our members to give their first conference talk. Then we held an all-day festival where we live-streamed their talks to the public. Not only was it a blast, those speakers saw their confidence skyrocket and applied to speak at more conferences! Another example is the Data Literacy Advocates group on LinkedIn run by Data Literacy. It’s a safe place for people to ask for advice and resources so they can confidently speak up about data topics at work.
Q: Lastly, your fans want to know: will you continue your freelancing practice, creating custom information design projects for your own clients, and will you keep recording and producing your own popular podcast, Data Viz Today?
A: Yes and yes! My podcast is like my baby, and I could never give it up — it’s a great way for me to stay connected to the data visualization community and stay on top of new innovations in the field. I plan to continue releasing new episodes on a monthly basis and sharing all the insights and stories that I discover. As for freelancing, I’ll continue accepting inquiries because I absolutely love designing graphics, but I’ll have to be extremely picky about the projects I accept. Advocating for data literacy is a big job, and I’m ready to dedicate myself to Data Literacy’s mission of helping people speak the language of data!
Okay, we hope you enjoyed this conversation with Alli, and that you’re as intrigued as we are about what she’s going to do next. If you’d like to connect with her, you can find her online in the following places:
- Read Alli’s blog posts to date on the Data Literacy blog
- Connect with Alli on LinkedIn
- Follow Alli on Twitter @AlliTorban
- Check out Alli’s website
- Subscribe to Alli’s monthly podcast, Data Viz Today
- Subscribe to Alli’s weekly newsletter, The Data Creative
Lastly, as you can imagine, we expect Alli to be in very high demand for our training offerings! If you’d like to make sure your own team gets a chance to join one of her sessions this year, be sure to fill out our Team Training Inquiry form, and we’ll set up some time to talk with you about your Data Literacy training needs today.

