An Illustrated Guide to Data Literacy: Bias in Research

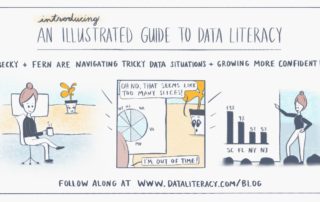
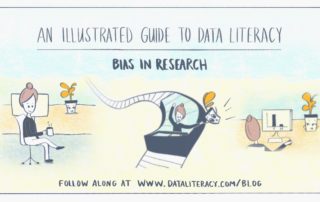
An Illustrated Guide to Data Literacy: Bias in Research Welcome back to our comic series that explores a range of data literacy concepts. We follow Becky, who describes herself as a bit data-phobic, as she navigates tricky situations at her new job. She'll learn to create effective charts, grasp statistical concepts, and [...]

By |2023-05-11T05:21:43-07:00September 1st, 2021|Helpful Explainers|Comments Off on An Illustrated Guide to Data Literacy: Bias in Research

Earn Data Literacy Training Badges

Training Badges Now Available! Organizations that have been implementing our online training courses have asked for badges, or "micro-credentials," to enable their employees to track and show progress in their learning journey. We're excited to announce that we've responded to this request and rolled out an Open Badge solution that is available [...]

By |2021-10-08T14:22:35-07:00August 27th, 2021|Announcements|Comments Off on Earn Data Literacy Training Badges

Data Journaling: an Analog Way to Learn About Data

Data Journaling: an Analog Way to Learn About Data Rebecca Gourley is a multimedia storyteller with a background in journalism and design. She’s a self-proclaimed nerd with interests in gaming, coding, hiking, crafts and plant-keeping. She’s been involved in data visualization work for the last couple of years and just completed the Certificate in Data [...]

By |2021-08-03T08:47:43-07:00August 3rd, 2021|Resources|Comments Off on Data Journaling: an Analog Way to Learn About Data

An Illustrated Guide to Data Literacy: Pie Charts

An Illustrated Guide to Data Literacy: Pie Charts Welcome to our new comic series that explores a range of data literacy concepts. We follow Becky, who describes herself as a bit data-phobic, as she navigates tricky situations at her new job. She'll learn to create effective charts, grasp statistical concepts and confidently [...]

By |2021-07-07T09:36:16-07:00July 7th, 2021|Helpful Explainers|Comments Off on An Illustrated Guide to Data Literacy: Pie Charts

The Difference Between “Prevalence” and “Incidence” and Why We Care

Like what you're reading? Learn all this and more in our on-demand course Data Literacy Fundamentals or purchase its companion book in PDF form. The Difference Between “Prevalence” and “Incidence” and Why We Care Have you heard the terms “prevalence” and “incidence” in the news lately? What’s the difference between them and [...]

By |2022-08-22T12:11:24-07:00April 27th, 2021|Helpful Explainers|0 Comments

Handmade in Punjab: embroidered data in phulkaris

Handmade in Punjab: embroidered data in phulkaris The following Women's History Month guest blog post was written by Sana Ahmed Wilder. Sana is a data visualizer specializing in building capacity of federal and state education agencies. She analyzes and communicates student data using modern visualization and storytelling techniques. Sana lives in [...]

By |2021-03-30T15:05:40-07:00March 29th, 2021|Personal Stories, Social Justice|0 Comments

Pivot Into a Data Career: How My Journey Can Help You Start Yours

Pivot Into a Data Career: How My Journey Can Help You Start Yours Alli Torban is a contributor to Data Literacy LLC. She’s an Information Design Consultant based in Washington, D.C. and hosts the podcast Data Viz Today. Alli specializes in designing data visualizations for industry experts to help get their work seen [...]

By |2021-03-25T14:57:10-07:00March 25th, 2021|Personal Stories, Uncategorized|0 Comments