Explained: Wide vs Long Format Data

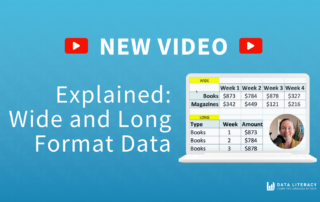
Explained: Wide and Long Format Data Ever found yourself puzzled because your chart didn't turn out as expected? The issue could be the format of your data. Data comes in two main formats: wide and long. In this video, I'll explain the differences between these formats, why they're important, and show you [...]

By |2024-01-05T14:43:13-07:00January 5th, 2024|Helpful Explainers, Tutorials|Comments Off on Explained: Wide vs Long Format Data

Trying out the Noteable Plugin for ChatGPT Plus

Trying out the Noteable plugin for ChatGPT Plus A couple of weeks ago, I was fortunate enough to have Elijah Meeks, Chief Innovation Officer of Noteable, walk me through how to use his new and popular Noteable plugin for ChatGPT, which is currently available to all ChatGPT Plus subscribers (currently [...]

By |2023-06-02T07:56:40-07:00June 1st, 2023|Tutorials, Videos|Comments Off on Trying out the Noteable Plugin for ChatGPT Plus

Trying Out Code Interpreter for ChatGPT

Trying out Code Interpreter for ChatGPT Today I had the chance to experiment with an early alpha release of the Code Interpreter plugin for ChatGPT by OpenAI. Code Interpreter is "an experimental model that can use Python, and that handles uploads and downloads. You can find information about this plugin here, and [...]

By |2023-05-08T16:15:04-07:00May 1st, 2023|Helpful Explainers, Tutorials, Videos|Comments Off on Trying Out Code Interpreter for ChatGPT

ChatGPT + Wolfram: A First Look

ChatGPT + Wolfram: A First Look It seems the marriage of statistical AI (LLMs such as OpenAI's ChatGPT) and symbolic AI (rules-based programming languages such as Wolfram Language) is poised to revolutionize how we perform some of the tasks of data analysis and data visualization, as well as how we go about [...]

By |2023-04-19T16:48:08-07:00March 29th, 2023|Tutorials|Comments Off on ChatGPT + Wolfram: A First Look

Here’s the ChatGPT prompt that reduced my meal-planning time by 90%

Here's the ChatGPT prompt that reduced my meal-planning time by 90% “I enjoy cooking, and I love meal planning!” —me, 10 years ago In this season of life, I’m always surprised by how quickly another meal comes. Everyone’s hungry? Again?! I used to enjoy watching cooking shows and scrolling through recipe blogs [...]

By |2023-04-10T12:36:45-07:00March 29th, 2023|Resources, Tutorials|Comments Off on Here’s the ChatGPT prompt that reduced my meal-planning time by 90%

How to Annotate Like a Designer

How to Annotate Like a Designer Do you wish the text in your charts looked more refined?  I’ll show you how to make your annotations look more professionally designed with a few small tweaks using PowerPoint. Once you see these tweaks in action, you’ll begin to make these refinements more naturally just like [...]

By |2022-02-27T17:59:48-07:00February 27th, 2022|Tutorials|Comments Off on How to Annotate Like a Designer

How to Make an Interactive Map with No Code

How to Make an Interactive Map with No Code Do you want to create your own interactive maps, but you don’t know where to start? I’m here to help! Let me show you how to make a map using Flourish Studio. We’ll go from spreadsheet to polished map that’s ready to embed [...]

By |2021-09-21T12:20:41-07:00September 21st, 2021|Tutorials|Comments Off on How to Make an Interactive Map with No Code

Tableau Training for Journalists at USC Annenberg

This past weekend, founder Ben Jones had the chance to travel to Los Angeles to train a group of professional journalists at USC on how to use Tableau Public, a free software product, to create an exploratory dashboard showing where high rates of vaccine preventable diseases had been recorded across California counties from 2001 to [...]

By |2019-10-29T16:47:43-07:00October 29th, 2019|Tutorials|0 Comments